Discover the Insider Secrets of Million-Dollar Crowdfunding Campaigns
Some clients pay us over $1,000,000 to run their
multi-million-dollar crowdfunding campaigns. For the first time ever, we’re pulling back the
curtains and showing you how we do it.
How to develop a product everybody wants
How to get 100,000 visitors to your page
How to increase sales by over 37%
What services to use... and which ones you shouldn’t waste time on
Kickstarter and Indiegogo Statistics: 2nd Semester of 2021
12.01.2022
Indiegogo and Kickstarter are 2 of the world’s most popular crowdfunding platforms. We’re sure you’ve read some crowdfunding stats, but there’s more to the story than that. Crowdfunding is a legit way to go if you’re looking for ways to fund your startup.
Will your idea do well on crowdfunding platforms? How much can you potentially raise?
To help you make an informed decision, we took it upon ourselves to collect, analyze, and report on some crucial data. In the end, we found some mind-blowing Indiegogo and Kickstarter stats that you need to know.
If you want to know more about the Kickstarter success rate, along with other crowdfunding statistics about backers, high-performing categories, and amounts raised for Kickstarter and Indiegogo, you’ve come to the right place.
Here is our midyear update on Kickstarter and Indiegogo crowdfunding stats for the second semester of 2021.
The main limitation of this research report regards data collection. Our sampling procedure was limited. Thus, we ended up with a smaller sample where we could gather quantitative data, especially for Indiegogo stats.
Since getting information about Indiegogo campaigns is much more complex than Kickstarter, our sampling sizes were unequal for both platforms. Nevertheless, we ensured that this crowdfunding market report conveys clear industry patterns and critical insights using different analysis tactics and strategies.
Kickstarter Stats: 2021
Kickstarter is one of the world’s most popular crowdfunding platforms. We’re sure you’ve read some crowdfunding stats, but there’s more to the story than that. Crowdfunding is a legit way to go if you’re looking for ways to fund your startup.
Will your idea do well on crowdfunding platforms? How much can you potentially raise?
To help you make an informed decision, we took it upon ourselves to collect, analyze, and report on some crucial data. In the end, we found some mind-blowing Kickstarter stats that you need to know.
If you want to know more about Kickstarter’s success rate and other crowdfunding statistics, including those about backers, high-performing categories, and amounts raised on Kickstarter, you’ve come to the right place.
Here is our annual update on Kickstarter crowdfunding stats.
Kickstarter Stats
These Kickstarter stats will surely tickle your brain if you want to know more about this giant crowdfunding platform.
We have selected 1,654 crowdfunding campaigns from 2021, which have received funding of over $50K each and have raised a total of about $540.5 million on Kickstarter.
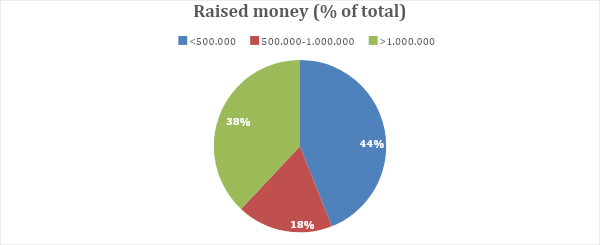
We divided these 1,654 projects into 3 groups according to their funding. It turns out that almost half of the money was raised by only 5.5% of these projects (95). In other words, 5.5% of the projects managed to raise 38% of the total funds.
Group
Raised money % of total
Number of projects, % of total
<500,000
44%
85%
500,000 – 1.000.000
18%
8.5%
1.000.000
38%
5.5%
Chart 1: 1,654 projects, $54,5M generated
Figure 1: The most successful crowdfunding campaigns on the Kickstarter platform (in 2021).
The number of products was high, but not all were elephants. It’s also worth mentioning that among the projects raised less than $500,000, almost 40% of funding was raised by 19% of projects ($250,000-$500,000).
So obviously, there were elephant campaigns that raised significantly higher amounts of money than an average crowdfunding campaign could reach. As you can already tell, the amount of funding plays a big role in a Kickstarter project’s success rate.
We will take a closer look at these campaigns and dissect them further in this section of our Kickstarter stats.
Now, let’s take a look at the campaign backers behind the funding of these crowdfunding projects.
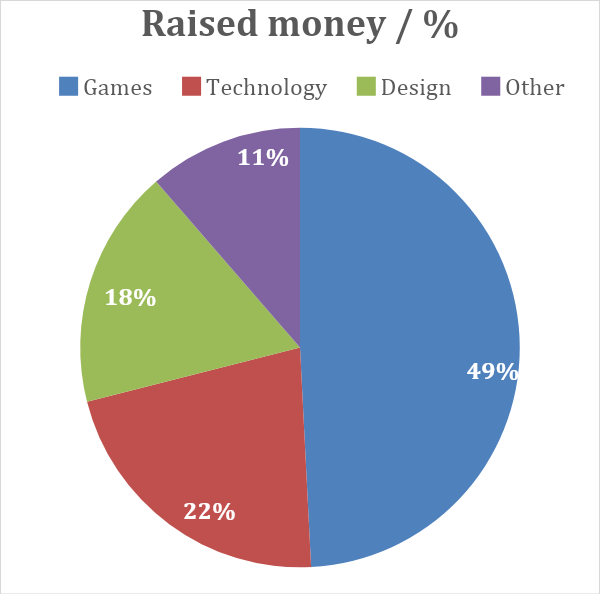
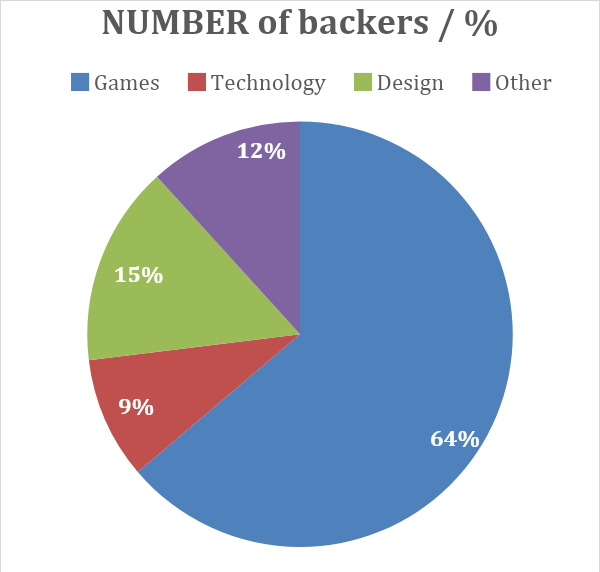
4, 723,578 crowdfunding project backers contributed across 15 product categories. Games, Design, and Technologies are in the lead, capturing 88% of campaign backers and an 88.5% share in the generated funds across only 3 categories.
Category
N of backers / %
Raised money / %
Games
3,013,505 / 63 %
265,870,913 / 49%
Technology
437,240 / 9 %
117,994,574 / 21.5 %
Design
718,662 / 15 %
95,196,498 / 17 %
Other
554,171 / 11%
61,387,432 / 11%
Chart 2: 4.7 mln backers, 3 favorite categories
Figure 2. Top product categories for a successful crowdfunding campaign on Kickstarter
The Technology product category generated a significant portion of money with a much smaller number of campaign backers. This shows that backers do not mind paying for pricey tech products if they are innovative enough.
Tech project backers need you to add significant value to their lives, and they’re ready to pay for it. This is one of the Kickstarter statistics that’ll make it easier for you to answer the question, “Is crowdfunding worth it for my project?”
So now, let’s deep dive into our crowdfunding stats for the 95 projects with over $1 million in funding.
More than half of the projects (34) are first-timers.
This means that projects and project owners (product creators) can even succeed on their first try. If you’re a first-time campaigner, just know that anything can happen.
As in the case of the total sample, the Games product category is the leader in campaigns that raised over $1 million.
The Design category takes second place, and it’s not a close call either. Although it has many campaign backers, it also has lower average prices – approximately $215.
And again, backers in the Technology category are ready to pay a higher price for their favorite innovative products. The average pledged money during 2021 – is $520.
Here’s a more detailed representation of the top product categories, their proportions, the average amount of money pledged, the number of backers, and the amount of funding generated.
The “Games” product category generated a significant portion of money with a bigger number of campaign backers.
Tech project backers need you to add significant value to their lives, and they’re ready to pay for it. This is one of the Kickstarter statistics that’ll make it easier for you to answer the question, “Is crowdfunding worth it for my project?”
Below, we can see the number of products per category. The least amount of the products fall within the “Theater” category:
Category
Count
Avg. Pledge
Backers
Raised Money
<$500K
$500k – $1 mln
$1 mln>
Games
556
55
59
$160
3.013.505
265.821.070
Design
304
27
16
$214
718.662
95.196.498
Technology
250
48
15
$518
437.240
117.994.574
Publishing
46
4
1
$150
101.245
10.979.567
Comics
67
3
1
$90
152.311
12.555.448
Film and Video
54
3
2
$200
115.795
15.702.037
Food
33
–
1
$343
30.707
4.726.378
Art
22
2
–
$104
57.282
4.929.193
Crafts
1
–
–
$456,21
152.311
343.070
Dance
1
–
–
$450,36
267
120.245
Fashion
55
3
–
$164
72.866
8.860.070
Journalism
1
–
–
$106,28
1713
182.063
Photography
9
–
–
$206
7919
1.631.035
Theater
1
–
–
$60
1646
98.632
Music
14
–
–
$139
11.668
1.259.692
Grand Total
1414
145
95
$219
4.723.578
Table 1. Summary of successful crowdfunding campaigns on the Kickstarter platform based on product categories and money raised
When identifying the crowdfunding projects with higher chances of becoming champions using these metrics, it becomes apparent that there are both high-price and low-price projects.
—
As for the product categories – the most popular ones have a higher number of total launches, thus a higher number of champions accordingly.
Still, there are champions in the least popular categories as well, which shows that the crowdfunding success rate of a crowdfunding project mainly depends on the product itself and the campaign marketing strategy rather than the price or category.
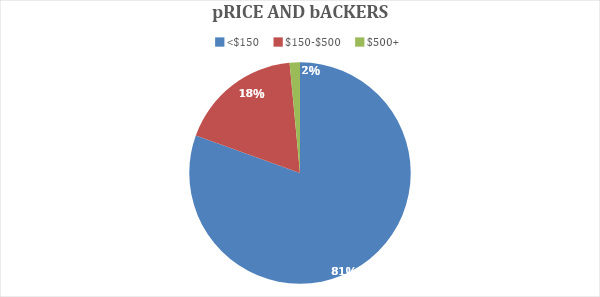
If we group the prices into 3 ranges, we can see that 74% of campaign backers funded crowdfunding projects with prices around $100-$200, while only 1.5% of them pledged anything more than $500.
Backers and Prices
<$150
80.5%
$150-$500
18%
$500+
1.5%
Figure 3. Percentage of backers based on the average amount of money pledged on Kickstarter
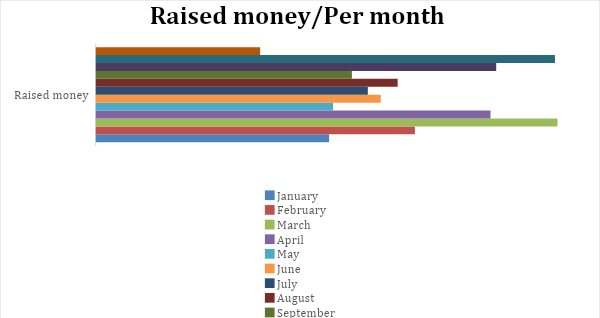
The following figure shows the funds raised during each month:
Month
Number of projects
Raised money
Backers
January
105
33.312.622
286.089
February
104
45.561.460
507.248
March
143
65.908.142
505.386
April
118
56.352.629
471.249
May
76
33.880.962
246.209
June
106
40.688.791
343.215
July
145
38.839.352
330.160
August
156
43.099.851
381.907
September
166
36.564.367
349.628
October
223
57.167.445
693.215
November
198
65.552.308
417.763
December
115
23.471.644
191.509
Figure 4. Generated/raised an amount of money from the campaigns per month on Kickstarter
Surprisingly, the most funds were raised during November, March, and October 2021. We also see a decreasing tendency through summer and December, which is typical because people travel more during the holiday season.
And that concludes our Kickstarter stats for 2021. If your genius idea is in the top 3 categories of Games, Design, and Technology, you have better chances of running a million-dollar campaign. In any case, if your product is worth it, no Kickstarter statistic should stop you from trying your luck. After all, the crowdfunding market is full of surprises.
Indiegogo Stats
Now that we’ve looked at one giant let’s take a look at the next one. Here are the Indiegogo stats you need to know from the second semester of 2021.
As mentioned before, we were limited in terms of data collection for Indiegogo, so there is a big difference in the sampling quantities between Indiegogo and Kickstarter stats.
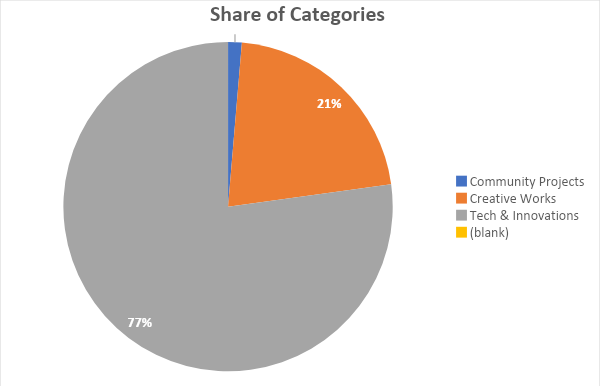
We have sampled 149 projects with budgets of over $50k that have raised $60 million across 16 categories in the second half of 2021.
Figure 5. Successful campaigns on Indiegogo per category (the 1st semester of 2021)
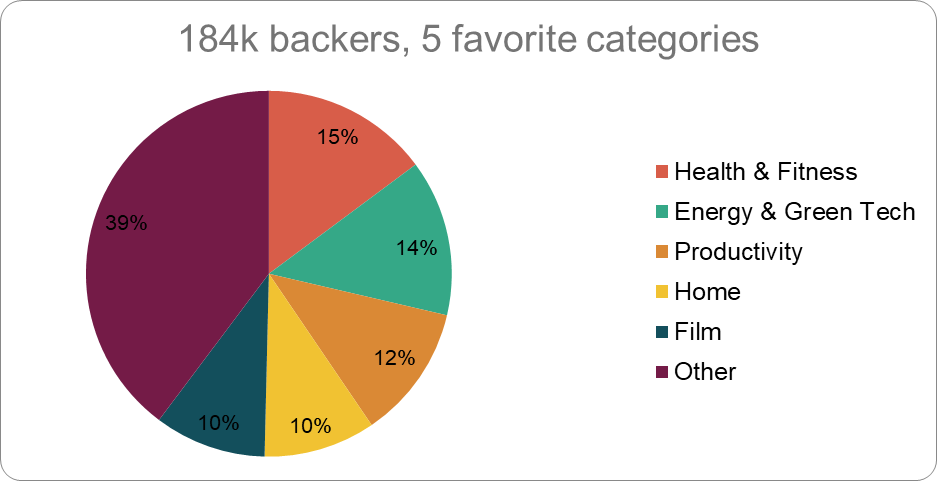
Let’s have a look at the backers behind the funding. In the first 6 months of 2021, 193K backers contributed to Indiegogo crowdfunding campaigns. The leading categories are “Home,” “Transportation,” and “Fashion and Wearables” in terms of the pledged money.
$60 million was generated on Indiegogo, via 193k backers, through 149 projects >$50k budget.
The top categories in terms of money raised are the following.
Home
Transportation
Fashion and wearables
Figure 6. Favorite product categories on Indiegogo
These top five subcategories generated about 53% of the total funds and 61% of the total number of backers.
Like we did with Kickstarter stats, let’s look deeper into Indiegogo stats for the 14 projects with >$1 million funding.
Among these champions, projects are those with significantly higher average pledges and fewer backers, as well as those with more backers and lower prices.
Indiegogo vs Kickstarter stats
Looking at the top 100 projects across two platforms, Kickstarter raised around two times more funds than Indiegogo, but with four times the backers. This means the average pledge on Indiegogo is significantly higher. In other words, Indiegogo has considerably fewer backers who don’t mind paying a higher price for better products.
The highest-funded project in the second half of 2021 on Indiegogo is the VAVA Chroma Triple Laser Projector which raised $6.5 million with 2k backers when the campaign was live.
On Kickstarter, the highest funded project is unsurprisingly a board game called “Avatar Legends: The Roleplaying Game,” which raised $9.5 million thanks to 81k backers. It was the third campaign by Magpie Games.
Summarizing the Second Half of 2021
969 crowdfunding campaigns with budgets above $50K raised more than $ 242 million on Kickstarter.
The top 3 categories in terms of both backer quantity and money raised are the following.
Games
Design
Technologies
$60 million was generated on Indiegogo, via 193k backers, through 149 projects >$50k budget.
The top categories in terms of money raised are the following.
Home
Transportation
Fashion and wearables
Your chances of raising more than $1 million for your first campaign are just as high as if you had already completed other successful or unsuccessful projects.
One of TCF’s recent campaigns, Kara Pure – the world’s 1st air-to-water dispenser of mineral-rich alkaline water, raised around $900k on Indiegogo, the first crowdfunding project for the creator company.
Shavarsh Zohrabyan
Shavarsh is a research and crowdfunding expert and the Head of the Research and Market Analysis department at the Crowdfunding Formula. His main interests are market analysis, business development, operations, etc.
Being an A-level economics and business tutor for over three years, he has excellent knowledge of finance and business-related topics, which comes in handy while doing research for crowdfunding campaigns.
Comments
Leave a Reply
The Kickstarter or Indiegogo Campaign Template That Drives High Conversions

Comments