Discover the Insider Secrets of Million-Dollar Crowdfunding Campaigns
Some clients pay us over $1,000,000 to run their
multi-million-dollar crowdfunding campaigns. For the first time ever, we’re pulling back the
curtains and showing you how we do it.
How to develop a product everybody wants
How to get 100,000 visitors to your page
How to increase sales by over 37%
What services to use... and which ones you shouldn’t waste time on
Indiegogo and Kickstarter Statistics: 1st Quarter of 2023
27.12.2023
Kickstarter and Indiegogo are the two leading reward-based crowdfunding platforms in the world. There’s no doubt about it. They have been instrumental in promoting innovative ideas and products from individual creators and even established brands.
We can learn a lot from crowdfunding market statistics, including the successes and failures of projects on these platforms. That is why we’ve gathered all the Kickstarter and Indiegogo statistics from January to March 2023.
In this report, we will present all the important Indiegogo and Kickstarter statistics for the 1st quarter of 2023 according to our own research results.
Whether you want to learn more about Kickstarter’s success rate, high-performing categories, amounts raised for Indiegogo, or other crowdfunding statistics, you’ve come to the right place.
Let’s dive right in and discuss all the crowdfunding success statistics you need to know.
Methodology and Limitations
During our comprehensive analysis of the Kickstarter and Indiegogo platforms, we based all our insights on core data. After gathering all the data we could, we began our research.
First, we examined the categories with the highest and lowest numbers of successful campaigns.
Next, we looked further into the number of backers and funds pledged to projects across different categories.
Last but not least, we dug deep into the prevailing trends on Kickstarter and Indiegogo to highlight the most popular categories and projects.
The primary limitations we encountered during our crowdfunding statistics research stemmed from the scarcity of data. Nevertheless, we did our best to create a general report that will give you an understanding of the main trends observed on these platforms.
It is important to note that collecting data on Indiegogo proved to be more challenging than collecting data on Kickstarter.
Kickstarter Stats | 1st Quarter of 2023
Kickstarter is one of the world’s most popular crowdfunding platforms. Hearing that the platform has successfully raised over $7.7 billion for just over 250,000 projects is impressive, but there’s more to the story than that.
All the success stories from crowdfunding statistics prove that crowdfunding is a legitimate way to go if you’re looking to fund your startup. But how much can you raise? Will your idea even do well on these crowdfunding platforms?
To help you make an informed decision, we took it upon ourselves to collect, analyze, and report on some crucial data.
Spoiler alert – we’ve found some mind-blowing Kickstarter statistics you need to know. So, let’s jump right in and start with our quarterly update on Kickstarter statistics on crowdfunding.
Kickstarter Statistics
According to Kickstarter average funding statistics, in the 1st quarter of 2023, more than 10,000 projects were launched. Out of all those projects, about 49% successfully reached their funding goal. The total amount of funding raised was around $140 million.
Most projects funded on Kickstarter from January to March were from first-time creators. This insight is consistent with the overall trend on Kickstarter, where first-time creators make up a significant portion of the platform’s users.
After analyzing all the data, we found several reasons first-time creators are so successful on Kickstarter.
Kickstarter provides an easy-to-use platform for first-time creators to get their projects in front of a large audience.
Kickstarter’s crowdfunding model allows first-time creators to raise the money they need to bring their projects to life without taking a big risk.
Kickstarter’s community of backers is supportive and enthusiastic about helping first-time creators succeed.
Aside from these learnings about first-time creator success, we also found other crowdfunding trends and statistics for Kickstarter in Q1 of 2023:
The most popular countries for Kickstarter projects in Q1 of 2023 were the United States, Canada, the United Kingdom, Australia, and Germany.
The most popular time to launch a Kickstarter project in Q1 of 2023 was Tuesday.
Kickstarter gender statistics show that most backers are male (64%) and between the ages of 25 and 44 (57%).
The most popular day of the week for Kickstarter projects to reach their funding goal was Friday.
The average project on Kickstarter in Q1 of 2023 took 33 days to reach its funding goal.
During our research on Kickstarter statistics for funded projects, we also found some common factors that contribute to the success of a Kickstarter project.
The project description should be clear and concise.
There needs to be a compelling video showcasing the project.
The pricing structure should be well-defined.
The project must have a solid social media presence.
The team should execute an engaging marketing campaign.
If you are considering launching a Kickstarter project, consider these factors as a priority for success. Don’t hesitate to research and learn as much as possible about the platform. There are many resources available online that can help you get started.
Top Successful Categories
Each platform has a number of categories that thrive more than others. In this ultimate Kickstarter statistics guide, this is a crucial learning point.
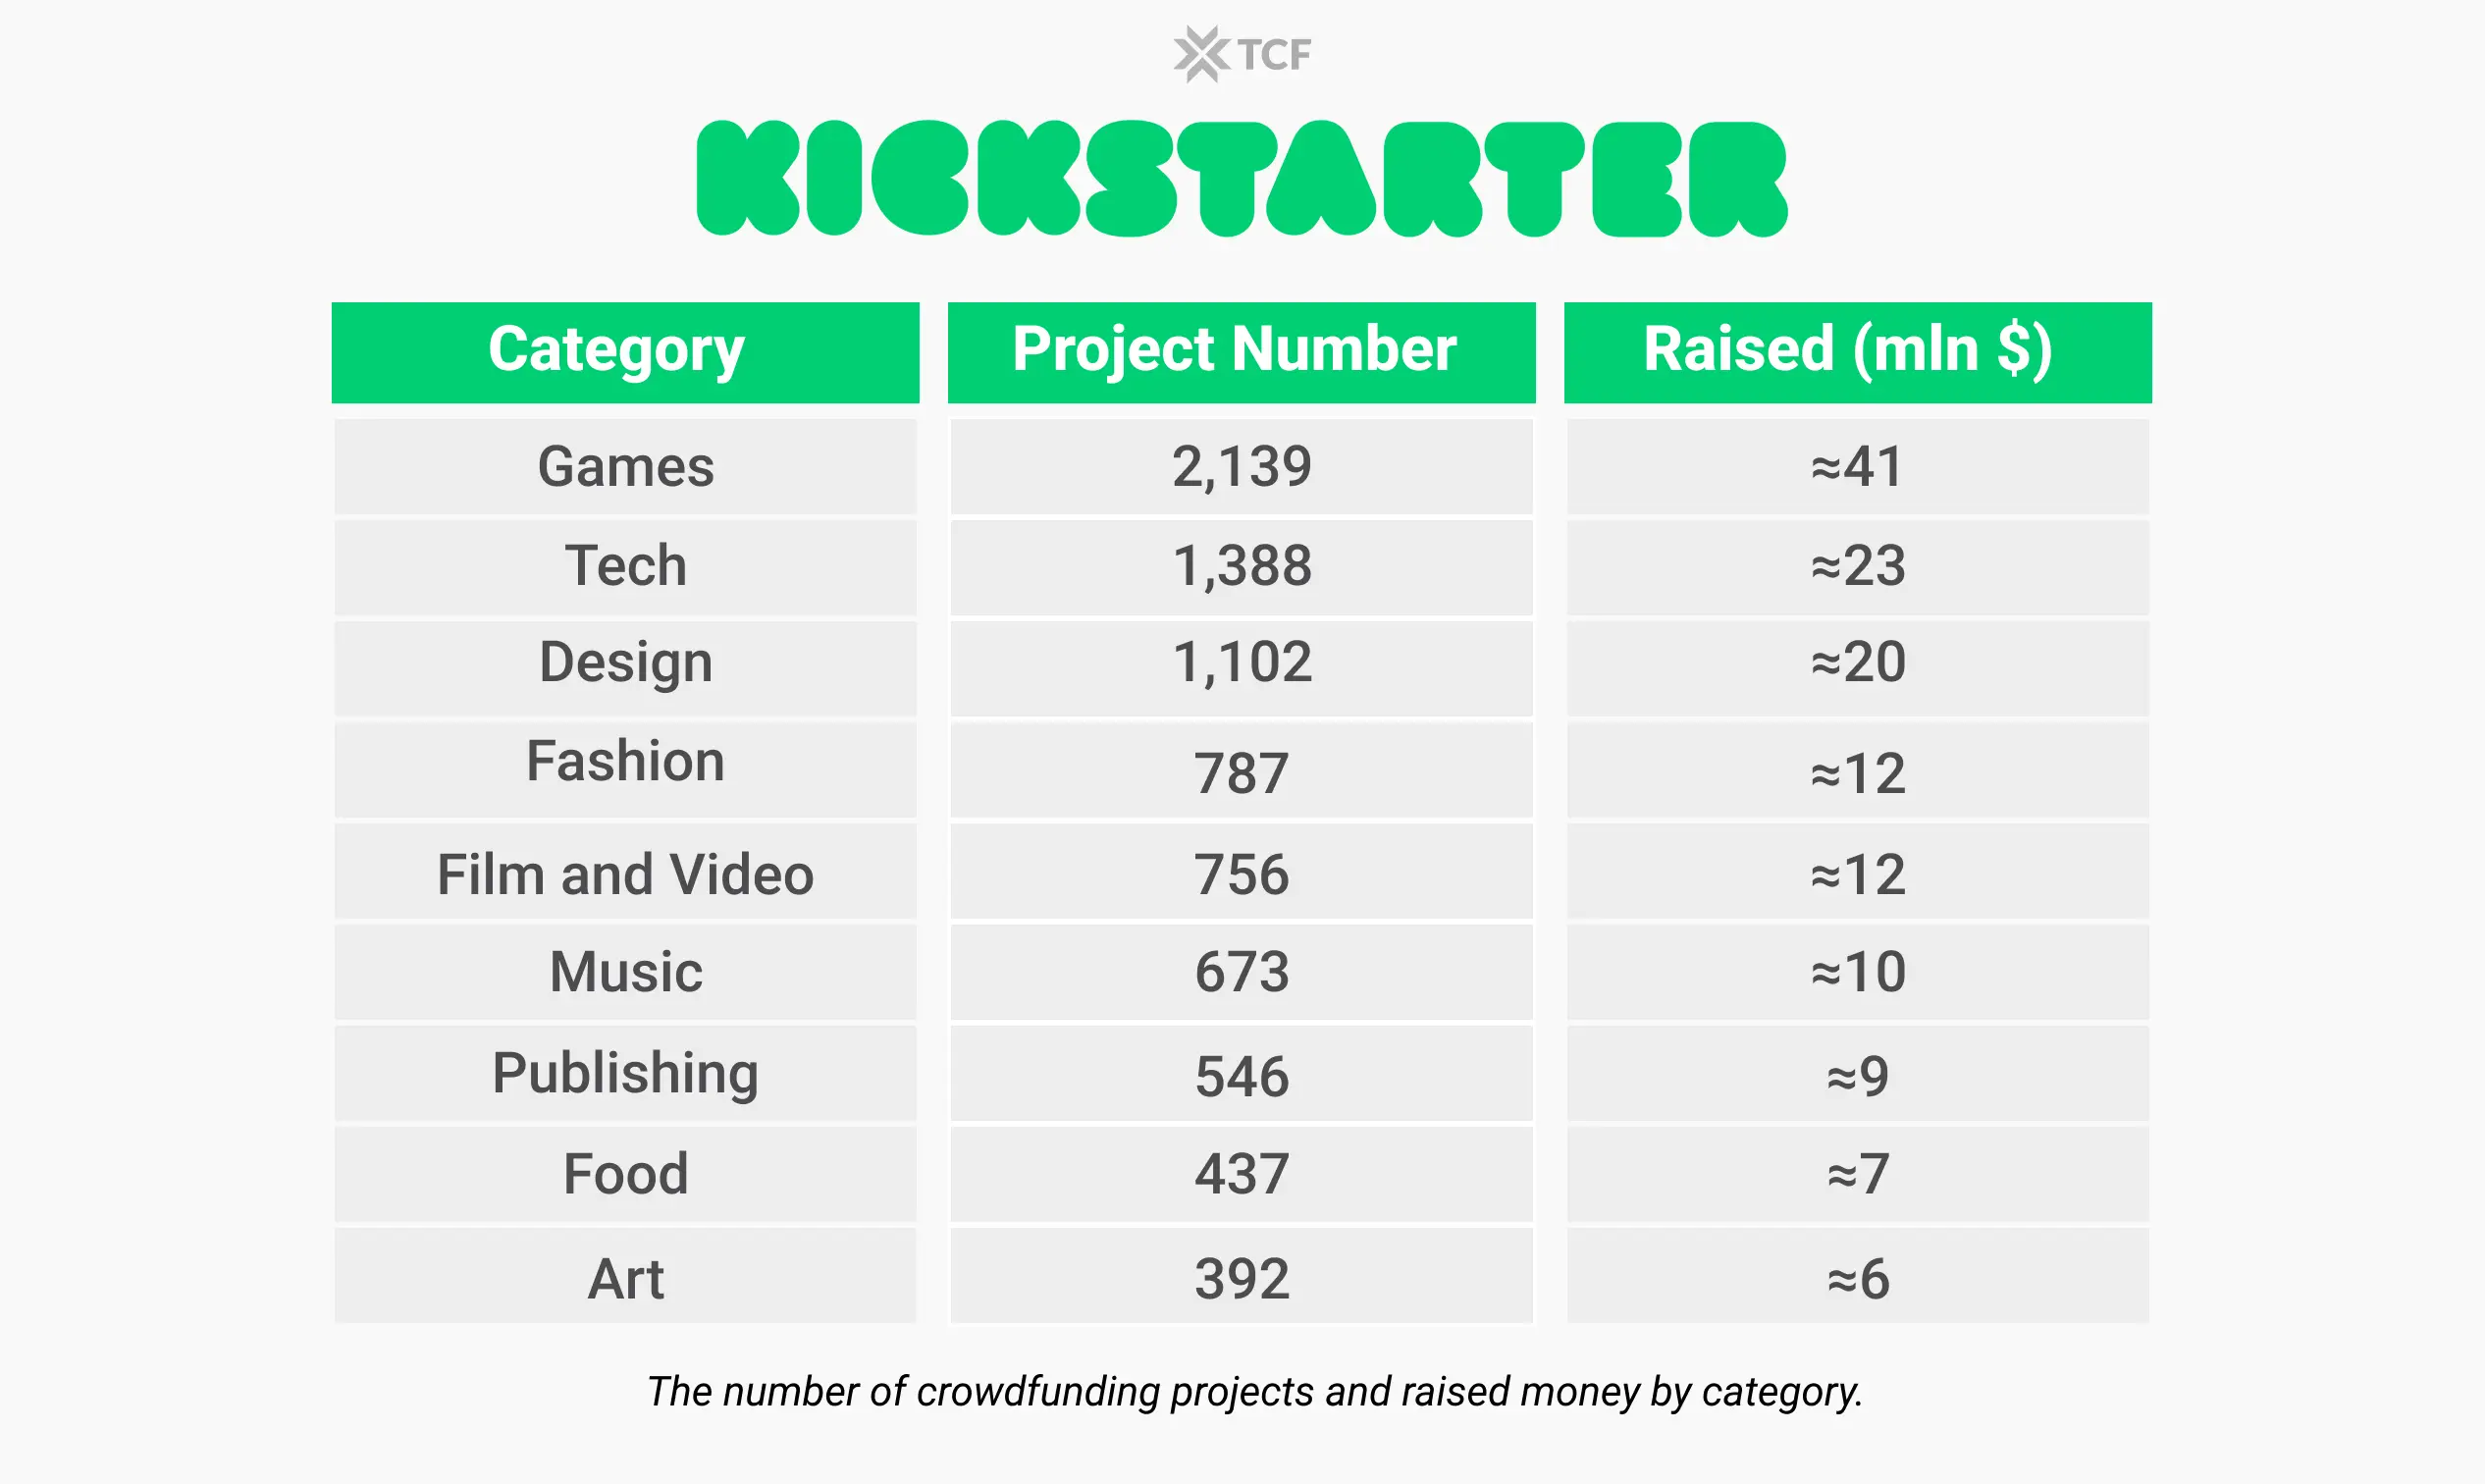
So, here is a breakdown of the most popular categories on Kickstarter, including the number of projects launched and the amount raised for each one.
The table above shows that the “Games” category raised the most: $41 million for 2,139 projects. The “Technology” and “Design” categories were also among the highest-funded, with $23 million (1,388 projects) and $20 million (1,102 projects) raised, respectively.
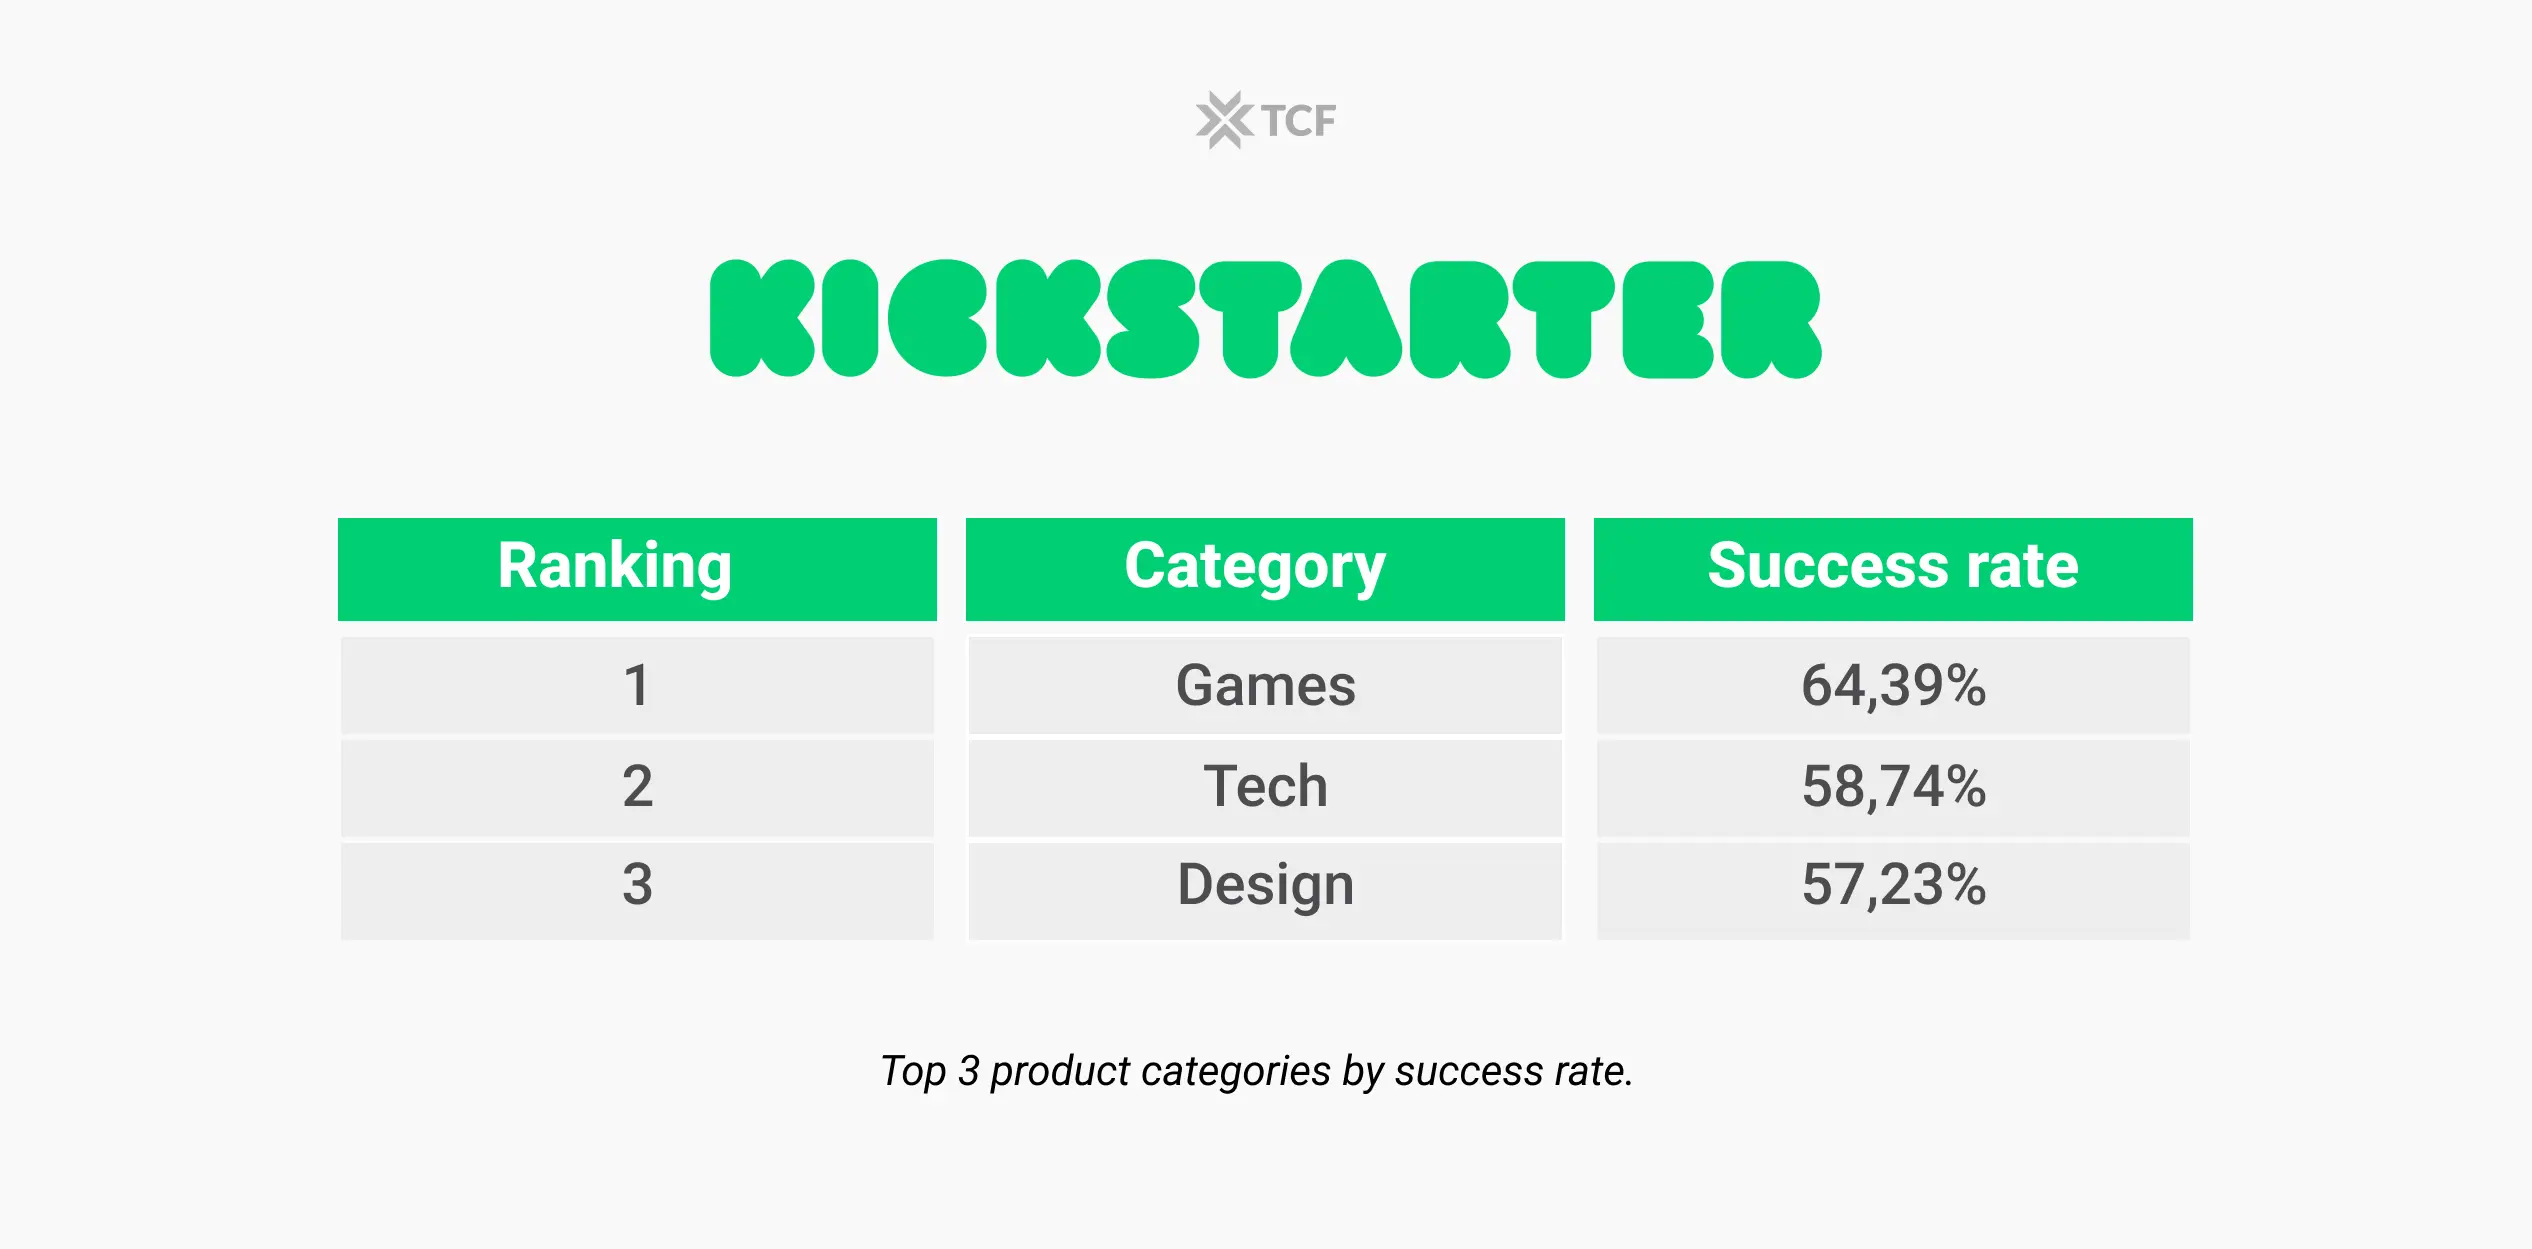
Among Kickstarter successful campaign statistics, there are always a couple of standouts. Some of Kickstarter’s many categories manage to raise more funding or have a higher success rate. Considering that the average success rate for all projects was around 50%, the top 3 categories did better than average.
The “Games” category had a success rate of 64.39% in Q1 of 2023. This means that 64.39% of Kickstarter game projects reached their funding goals.
58.74% of “Technology” projects and 57.23% of “Design” projects on Kickstarter successfully reached their funding goals and raised enough money to bring their ideas to life.
In the “Games” category, we see mostly board games and physical tabletop games that excite the adventurer in you. The most popular games are the ones that also contain a storybook accompanying the board game.
Technology
We decided that the “Technology” category deserves special attention in Kickstarter statistics. “Technology” is the most diverse of all projects on the platform, varying from portable LED Screens and gaming consoles to 3D Printers, innovative text scanners, and even cute robots.
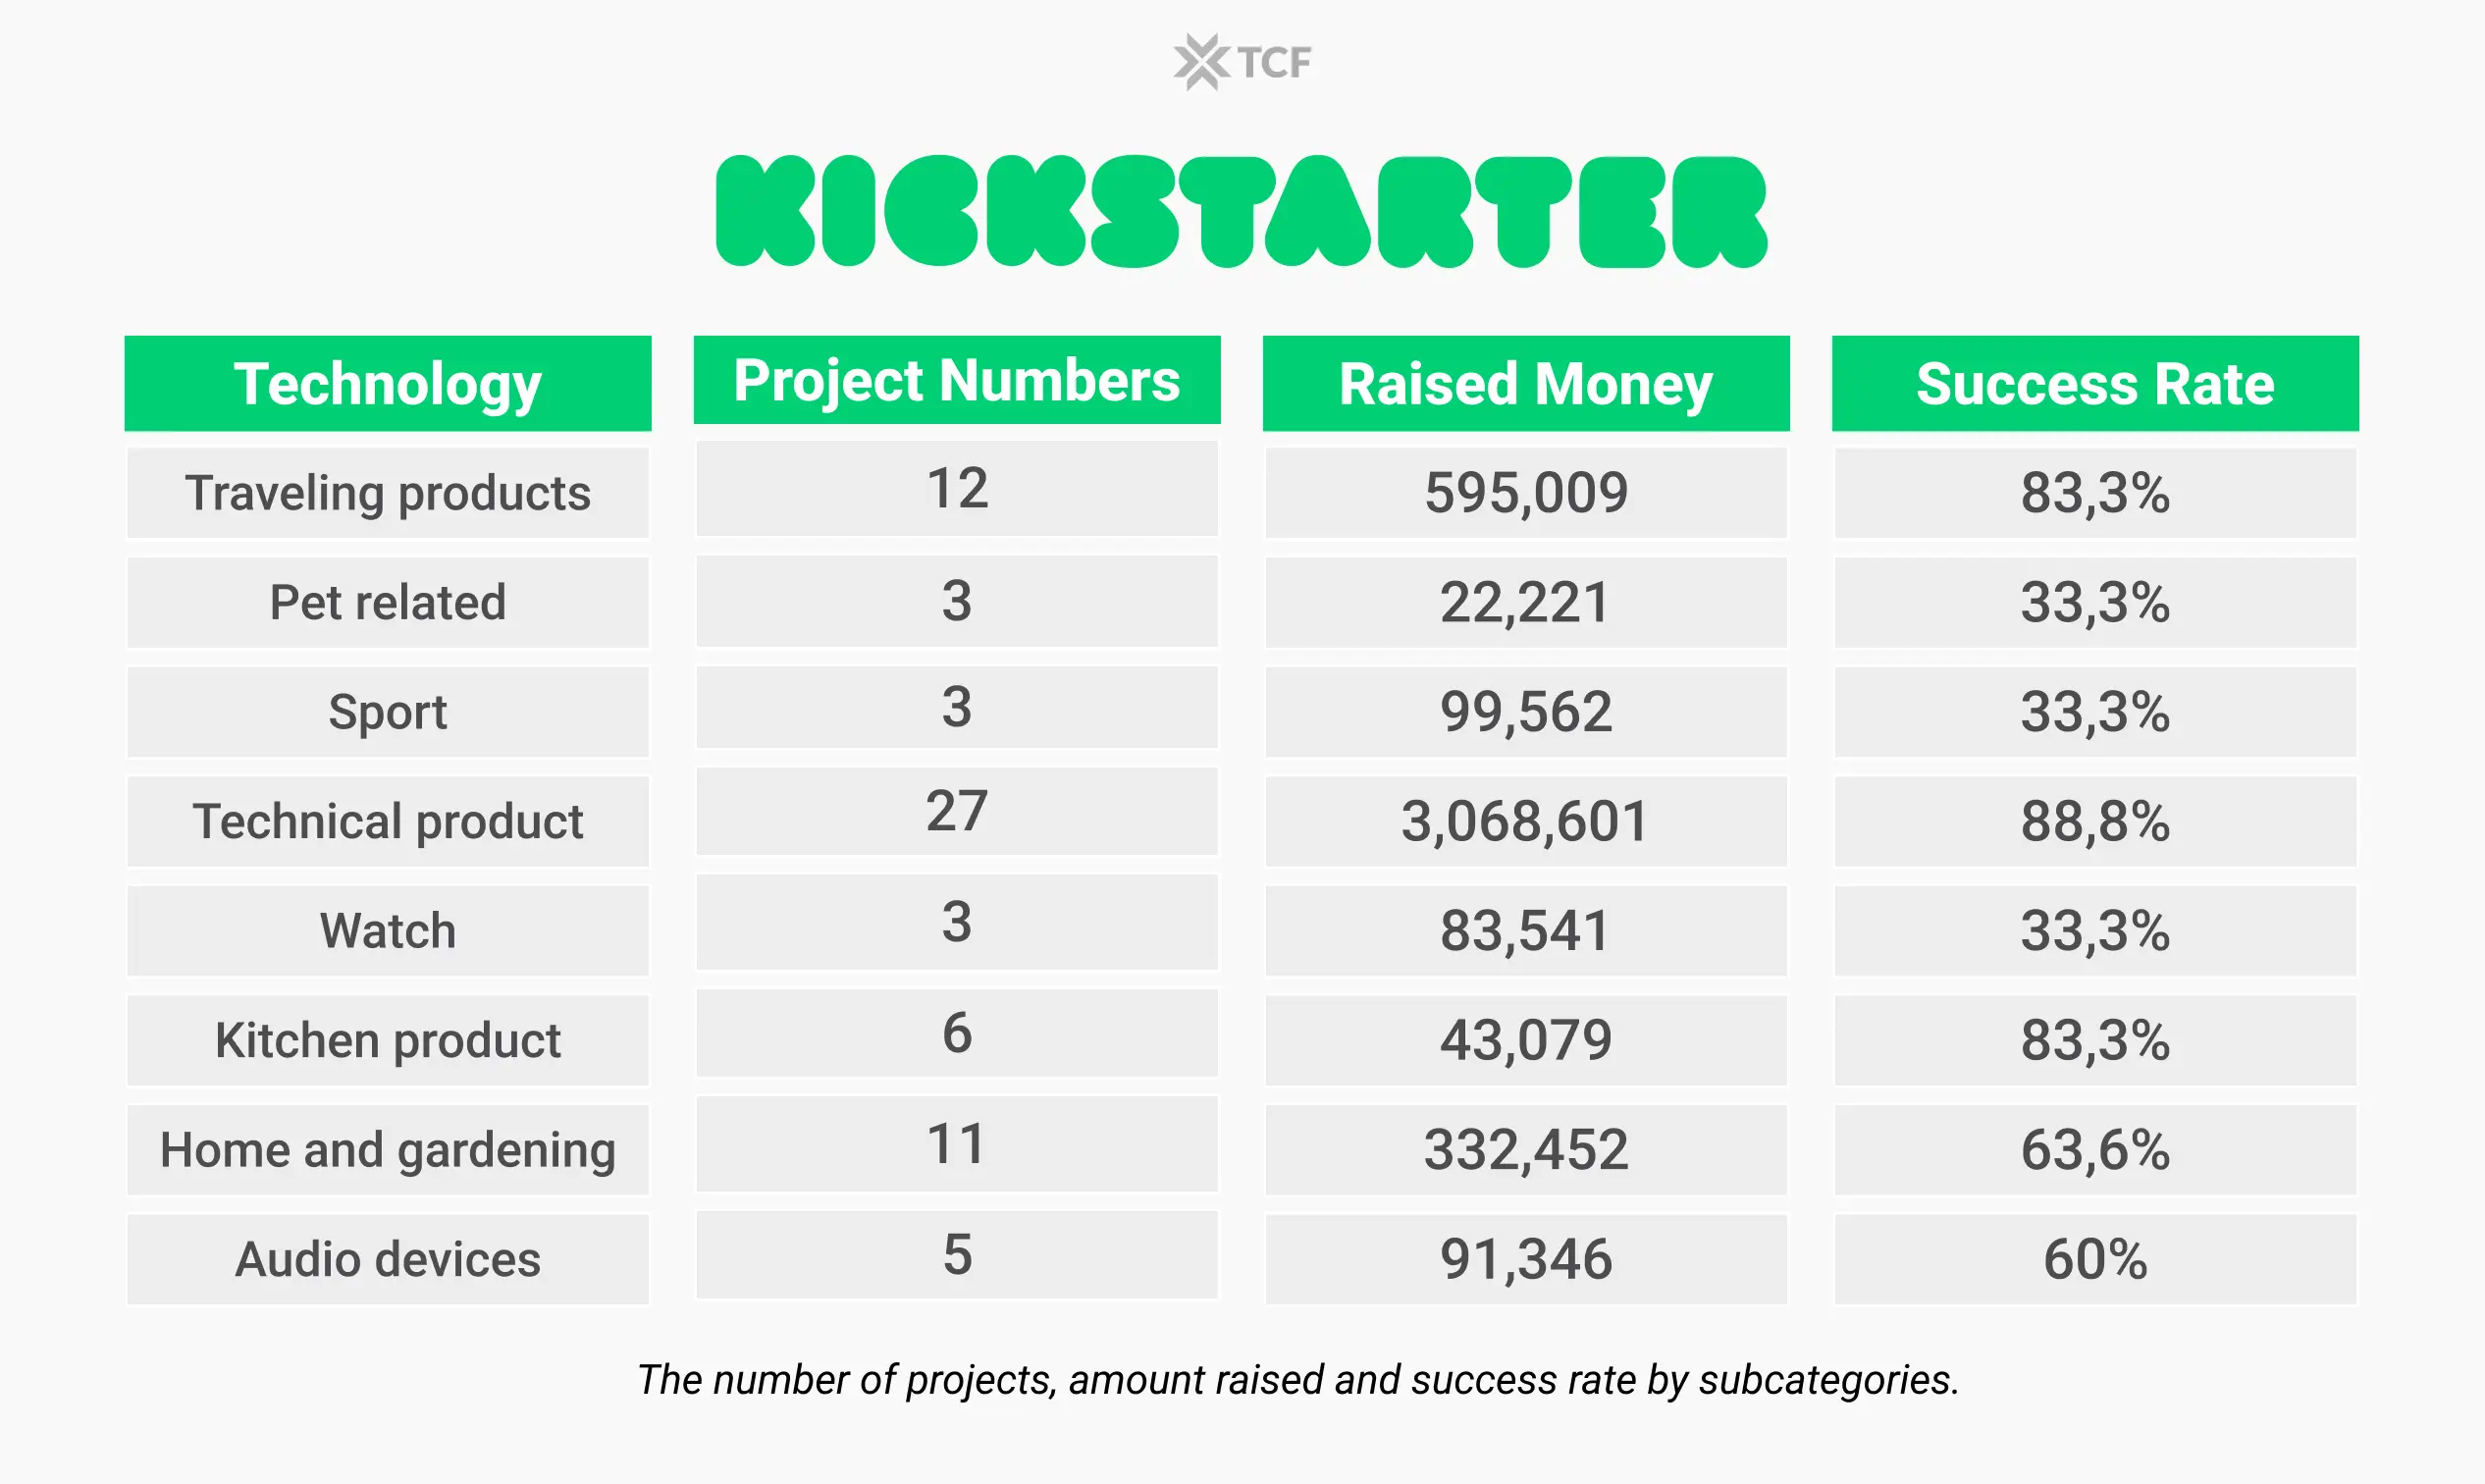
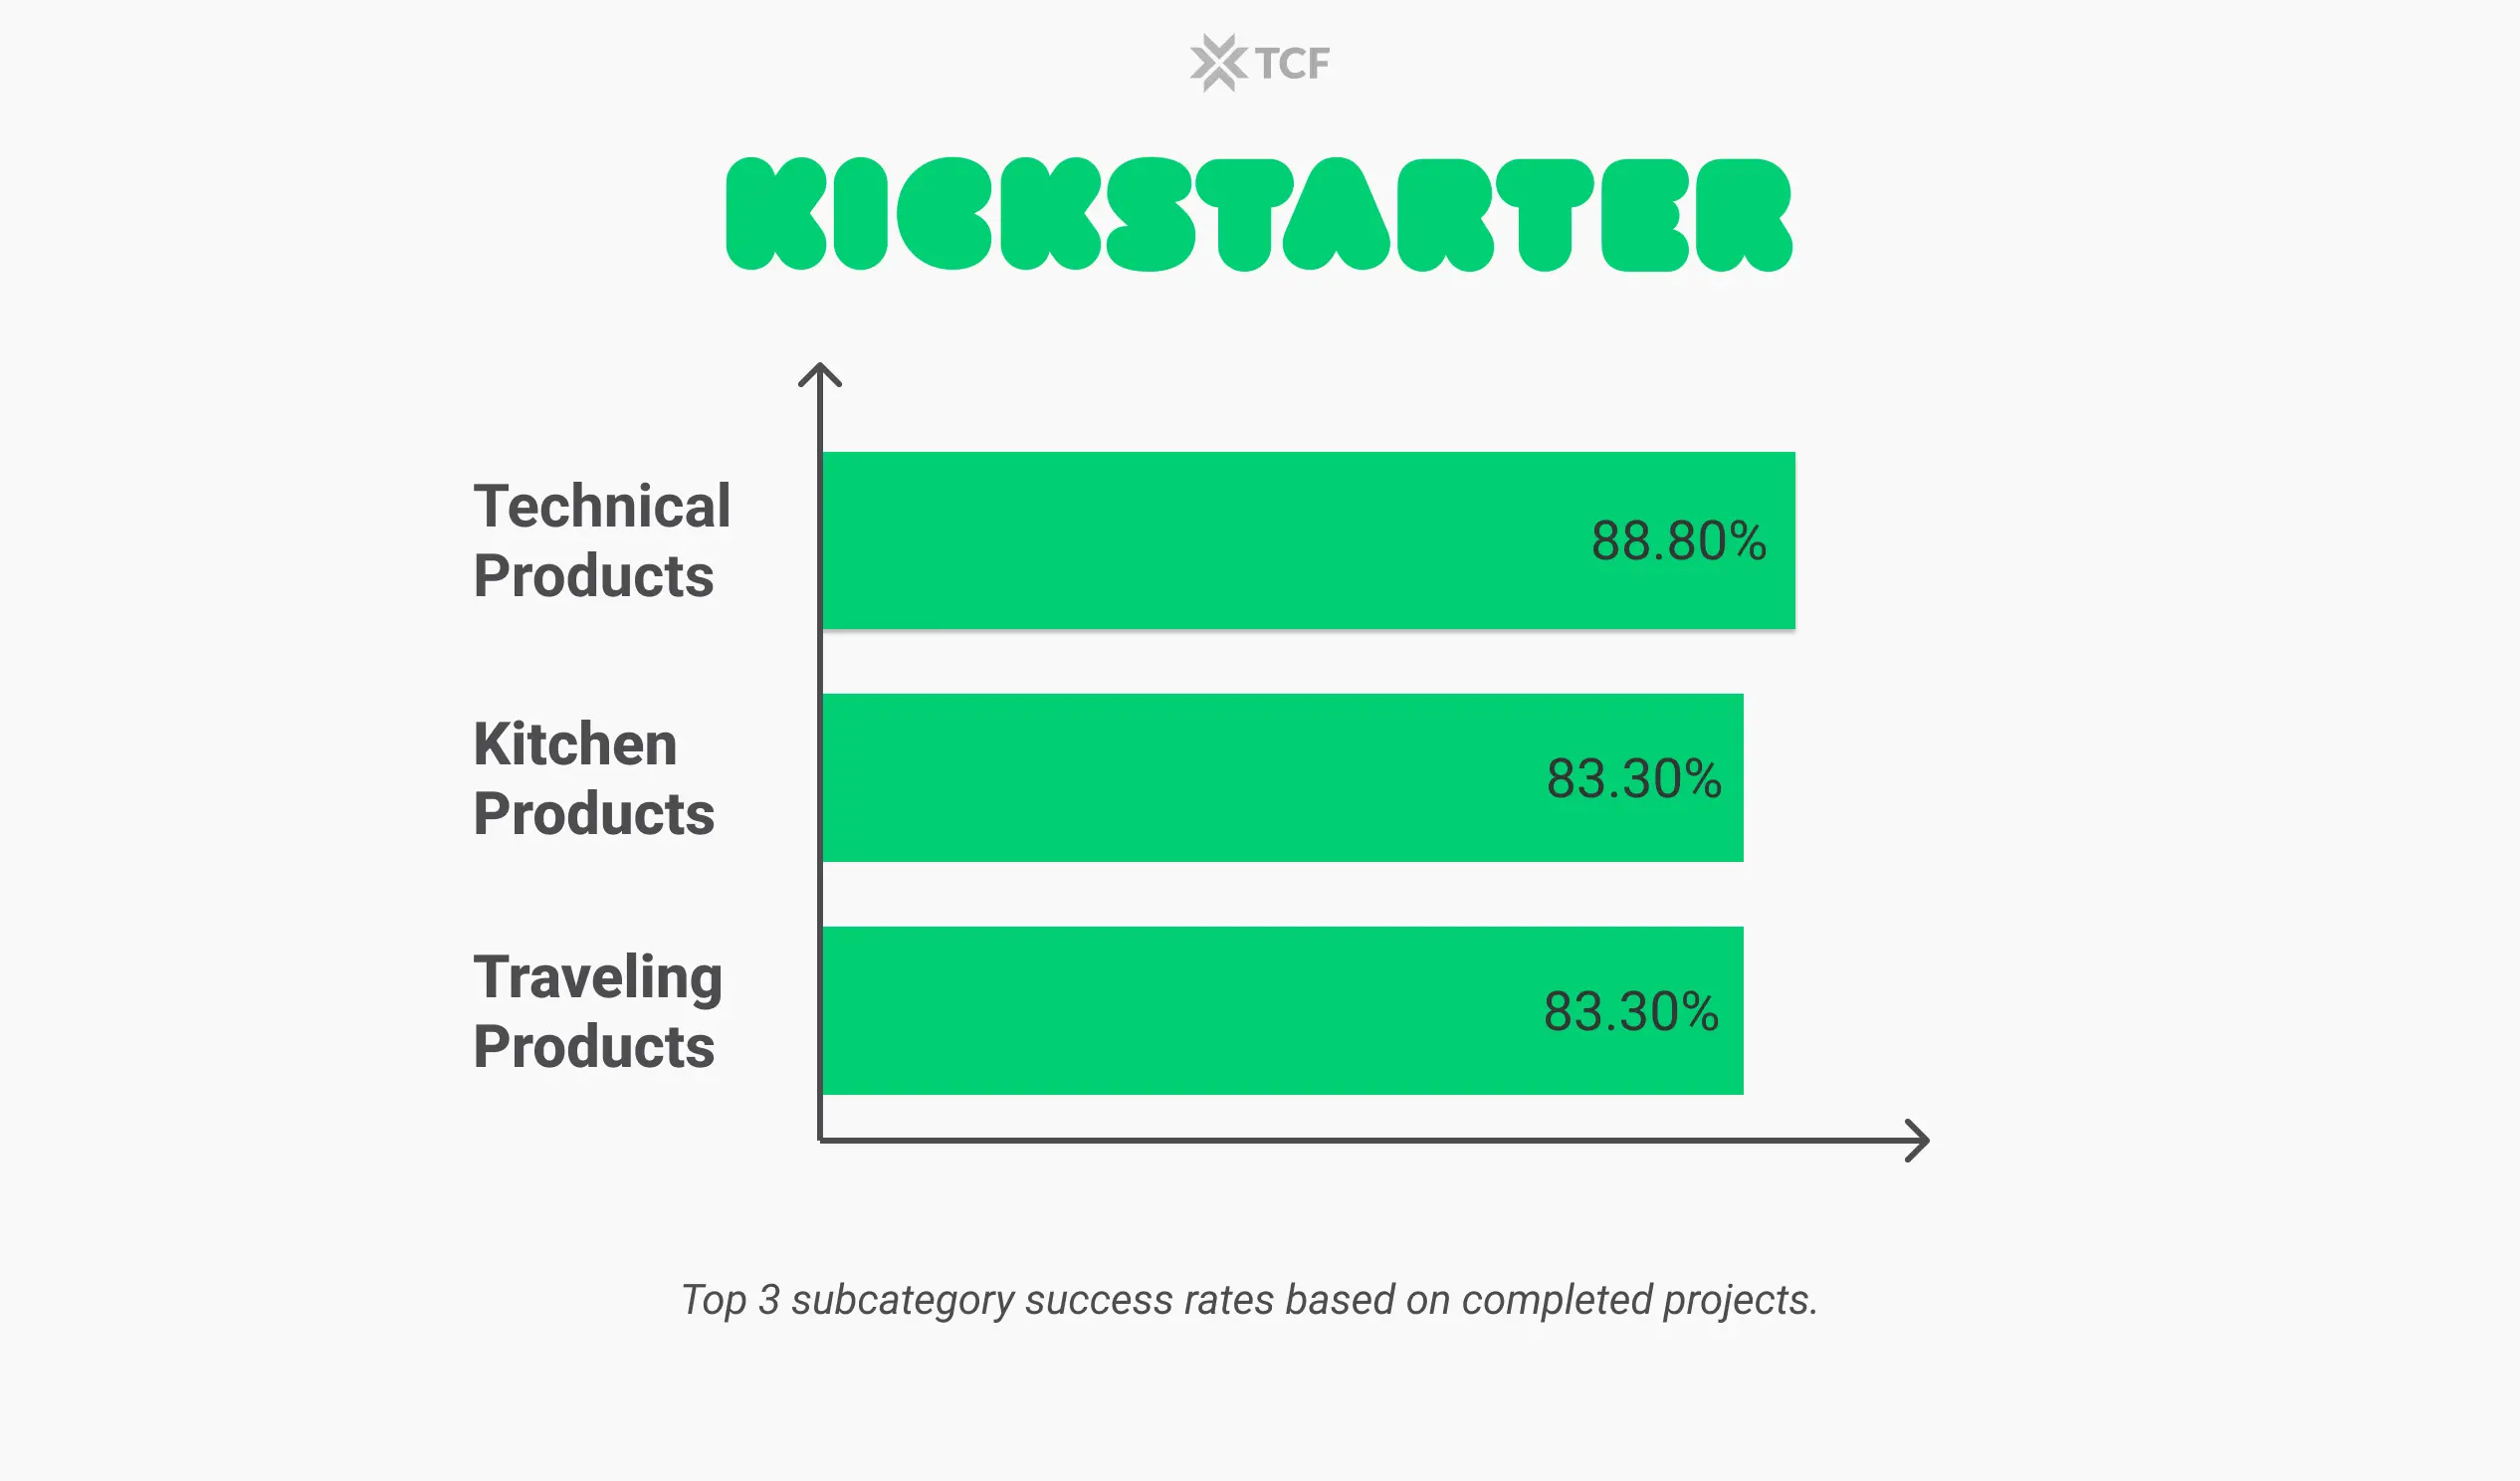
We sampled 70 projects from the “Technology” category and found several sub-categories. As shown in Figure 1 above, “Technical Products” (gadgets) not only lead in the number of projects but also dominate in the raised money category.
According to Kickstarter statistics, technological innovation is the juggernaut of the crowdfunding business.
In the 3rd column of Figure 1, we can also see the success rates of the top 3 sub-categories based on our sampled projects. This means that 88.8% of “Kitchen Products,” 83.3% of “Technical Products,” and 88.3% of “Travelling Products” managed to achieve their defined goals with the highest success rates.
Looking at the numbers, we can conclude that there is a high probability that you’ll achieve your project goal if you launch a product in the “Kitchen Products,” “Technical Products,” and “Travelling Products” categories. But it’s never as black and white as that.
A high success rate highly depends on the defined goal. For example, most of the “Kitchen Products” goals were set at less than $5,000, making it much easier to achieve than projects with higher goals. Achieving your project goal is way more difficult for technical products because the goals are usually defined higher.
The moral of the story is – success rates can give biased insights if you don’t dig deeper into the numbers.
Successful Projects
The most successful project on Kickstarter in Q1 of 2023 was Dungeons & Lasers ® V: World of Deuslair 5E by Archon Studio. The project managed to raise $1.1 million from 5,813 backers. They launched the campaign on January 10, 2023, and ended on February 10, 2023, with just 30 days of campaigning.
Another successful project in Q1 of 2023 was Keychron Q1 Pro -QMK/VIA Wireless Custom Mechanical Keyboard, which raised $624,392 from 2,888 backers. The project was launched by Keychron – a company that manufactures mechanical keyboards. The Keychron Q1 Pro is a wireless mechanical keyboard that is customizable with different switches, keycaps, and case colors.
Successful month in the first quarter
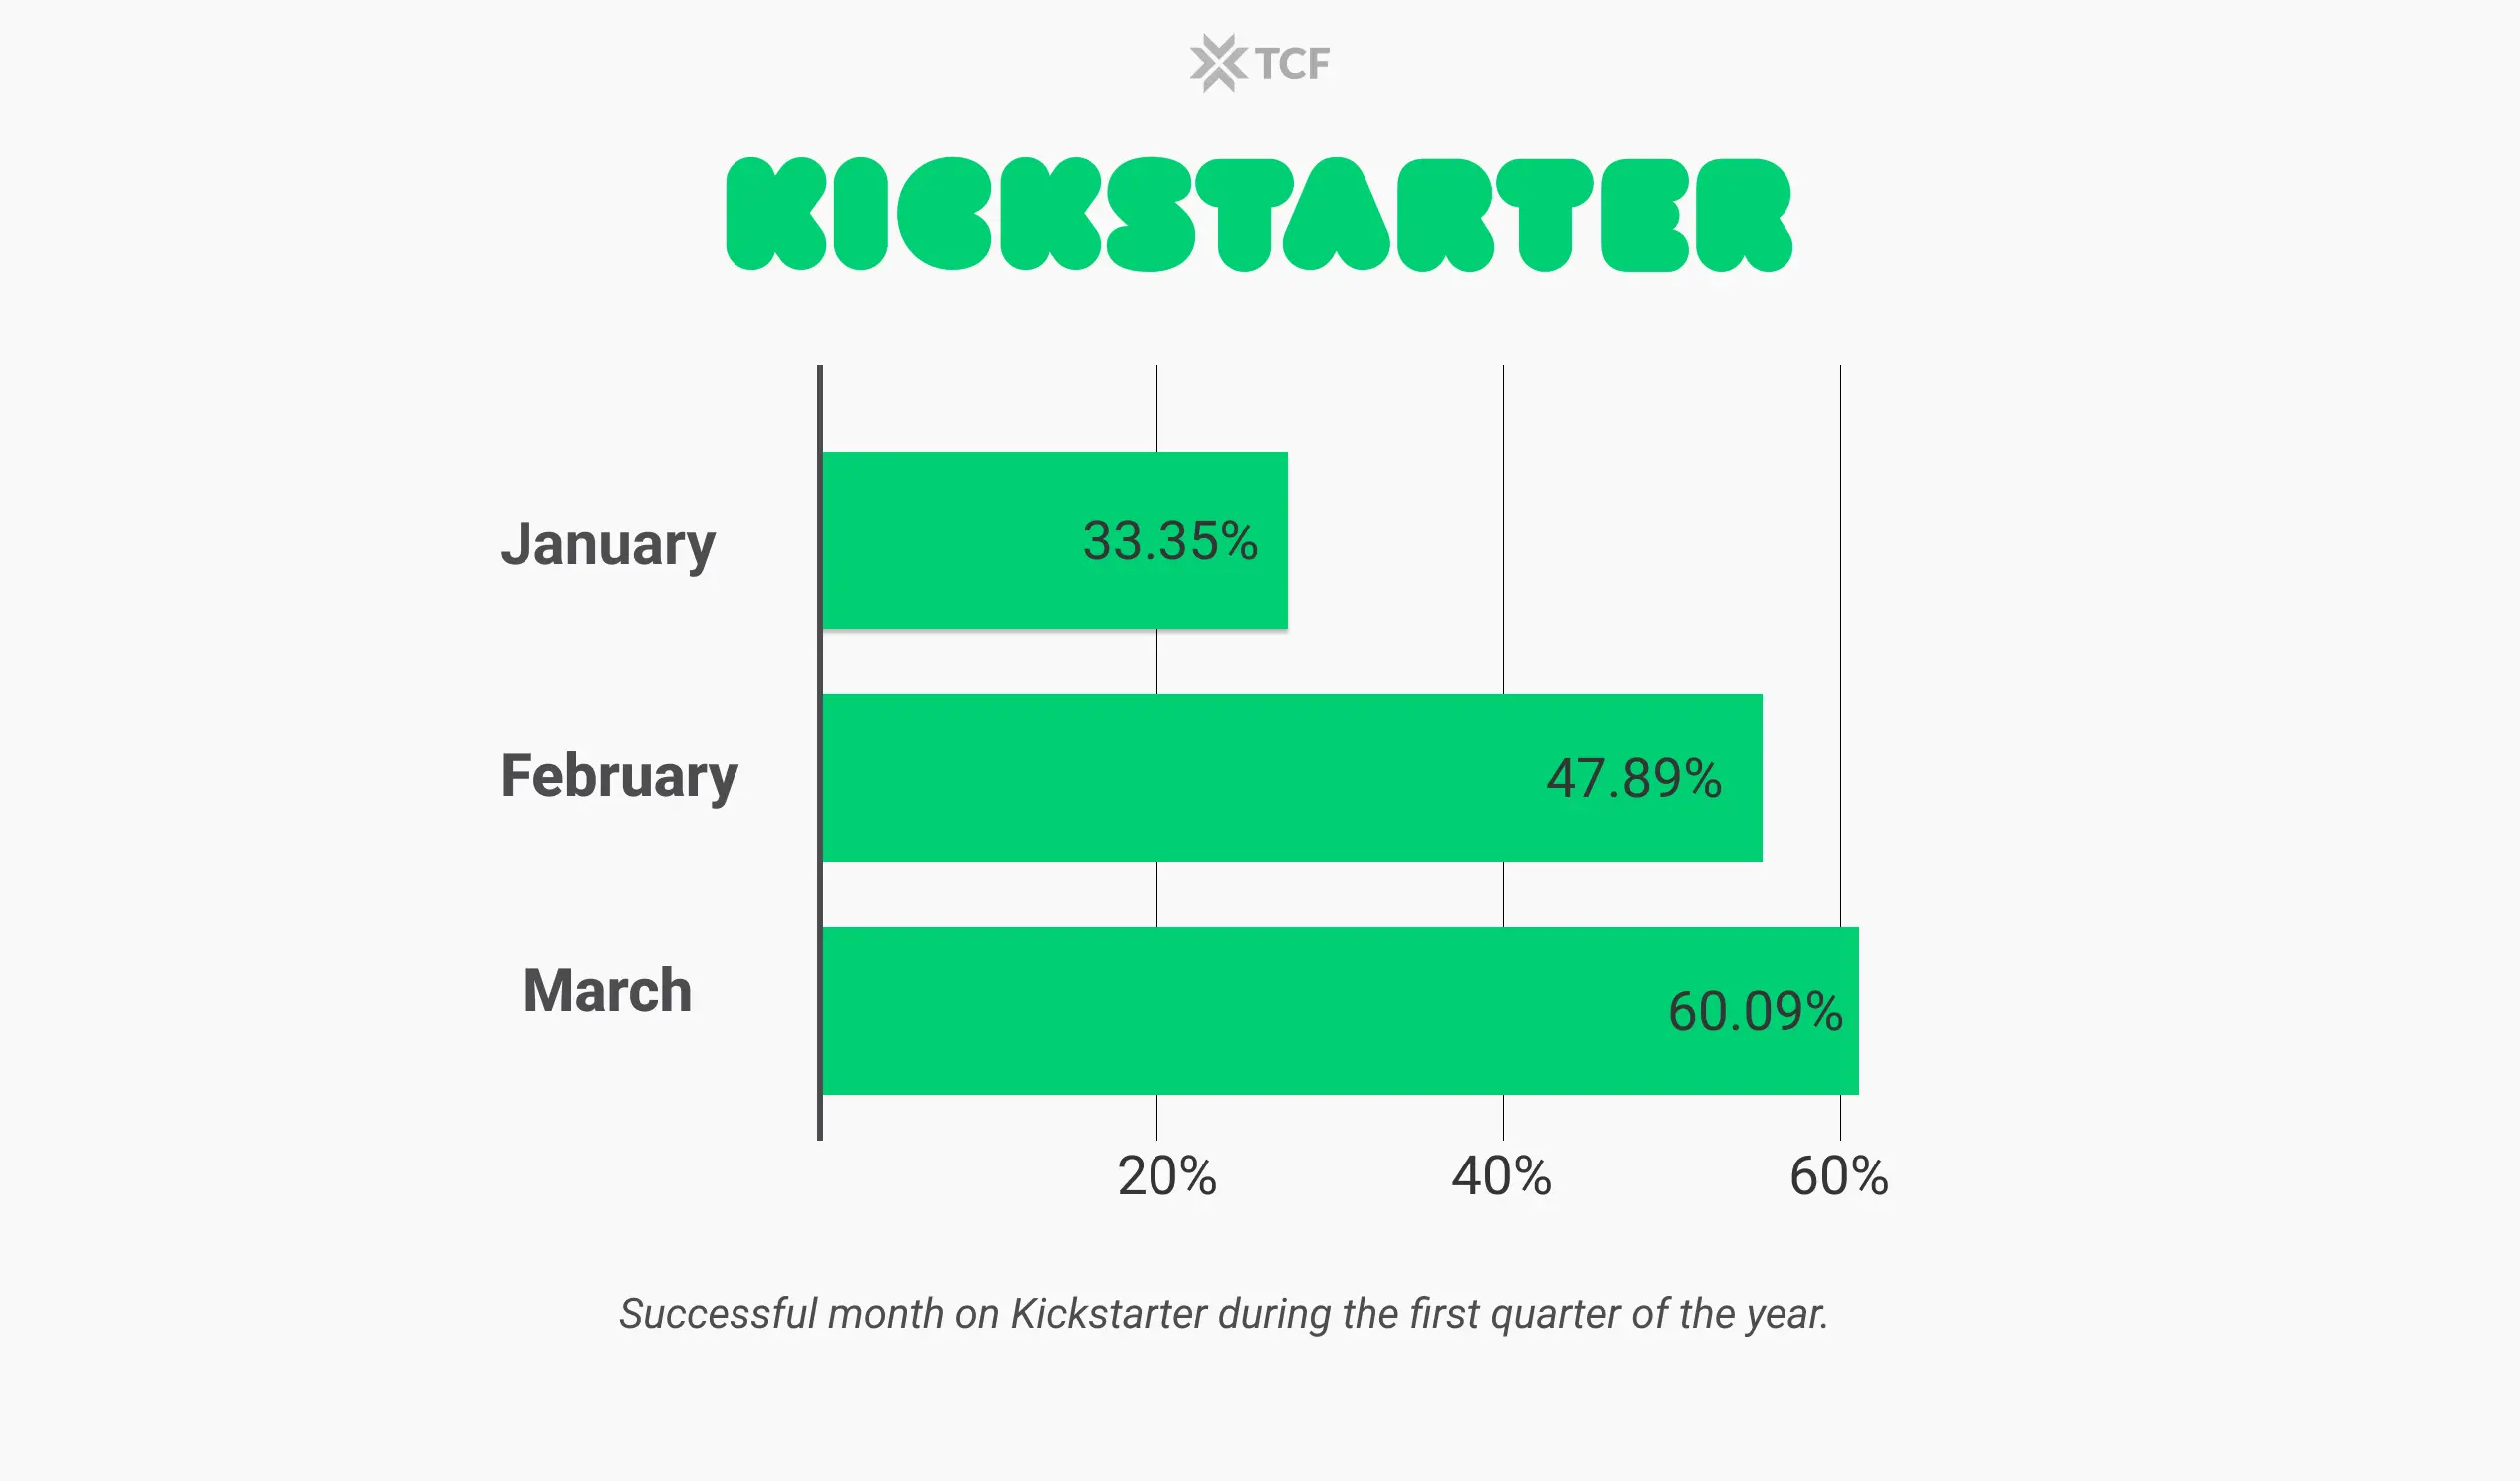
According to Pledgebox’s report, based on data from Q1 of 2023, your project is most likely to succeed on Kickstarter if you launch in March. The study found that projects launched in March had a success rate of 60.09%, compared to 33.35% in January and 47.89% in February.
The study also found that the success rate of projects on Kickstarter varies depending on the project category, further proving the findings from our research.
Top 3 Unsuccessful Categories
Now that we’ve discussed the most successful categories, let’s talk about the other side of the coin. The Pledgebox study found impactful Kickstarter project statistics, including the fact that the project category, the timing of the launch, and the quality of the campaign can impact the success of a project in both good and bad ways.
If March were the best month for launching, then the worst month for launch would be January, with only a 33.35% success rate (66.65% failure rate).
As in previous years, the least successful categories are still the same for Q1 of 2023։, “Art,” “Publishing,” and “Fashion.”
The percentage of projects funded in these categories was significantly lower than the average percentage financed across all categories. This suggests that these 3 categories are more challenging to succeed in on Kickstarter.
According to our research, there are a few possible reasons why these categories are more challenging to succeed in.
These categories may be less popular with Kickstarter users.
These categories may require more work to execute successfully.
These categories may be more competitive, with more projects competing for funding.
If you are planning to launch a project on Kickstarter in one of these 3 least successful categories, here are some tips for increasing your chances of success:
Do your research, validate your product/idea, and ensure that there is demand for it in the market.
Create a strong page explaining your project and why it is worth funding.
Set a realistic funding goal and offer compelling rewards for backers.
Promote your project on social media and other channels.
Kickstarter Statistics Trends
Lastly, in our Kickstarter statistics guide, let’s talk about the 2 main trends we found for Q1 of 2023.
The popularity of projects in the “Gaming” category is steadily increasing.
Projects that offer backers unique experiences, such as attending a private event or meeting the project’s creator, have a growing interest among Kickstarter backers.
Overall, Q1 of 2023 was a strong quarter for Kickstarter. Many projects were launched, and significant funding was raised. The platform remains a popular destination for creative entrepreneurs looking to bring their ideas to life.
Indiegogo Statistics
Now that we’ve discussed Kickstarter, let’s dive into Indiegogo statistics for Q1 of 2023. If you’re unfamiliar with the platform, Indiegogo is the other market leader in reward-based crowdfunding that allows people to raise money for their creative projects.
As mentioned, data collection for Indiegogo was more challenging than Kickstarter. This limitation is why there is a difference in the analysis of Indiegogo and Kickstarter statistics.
Nevertheless, look at some of the most important statistics on running an Indiegogo campaign from Q1 of 2023.
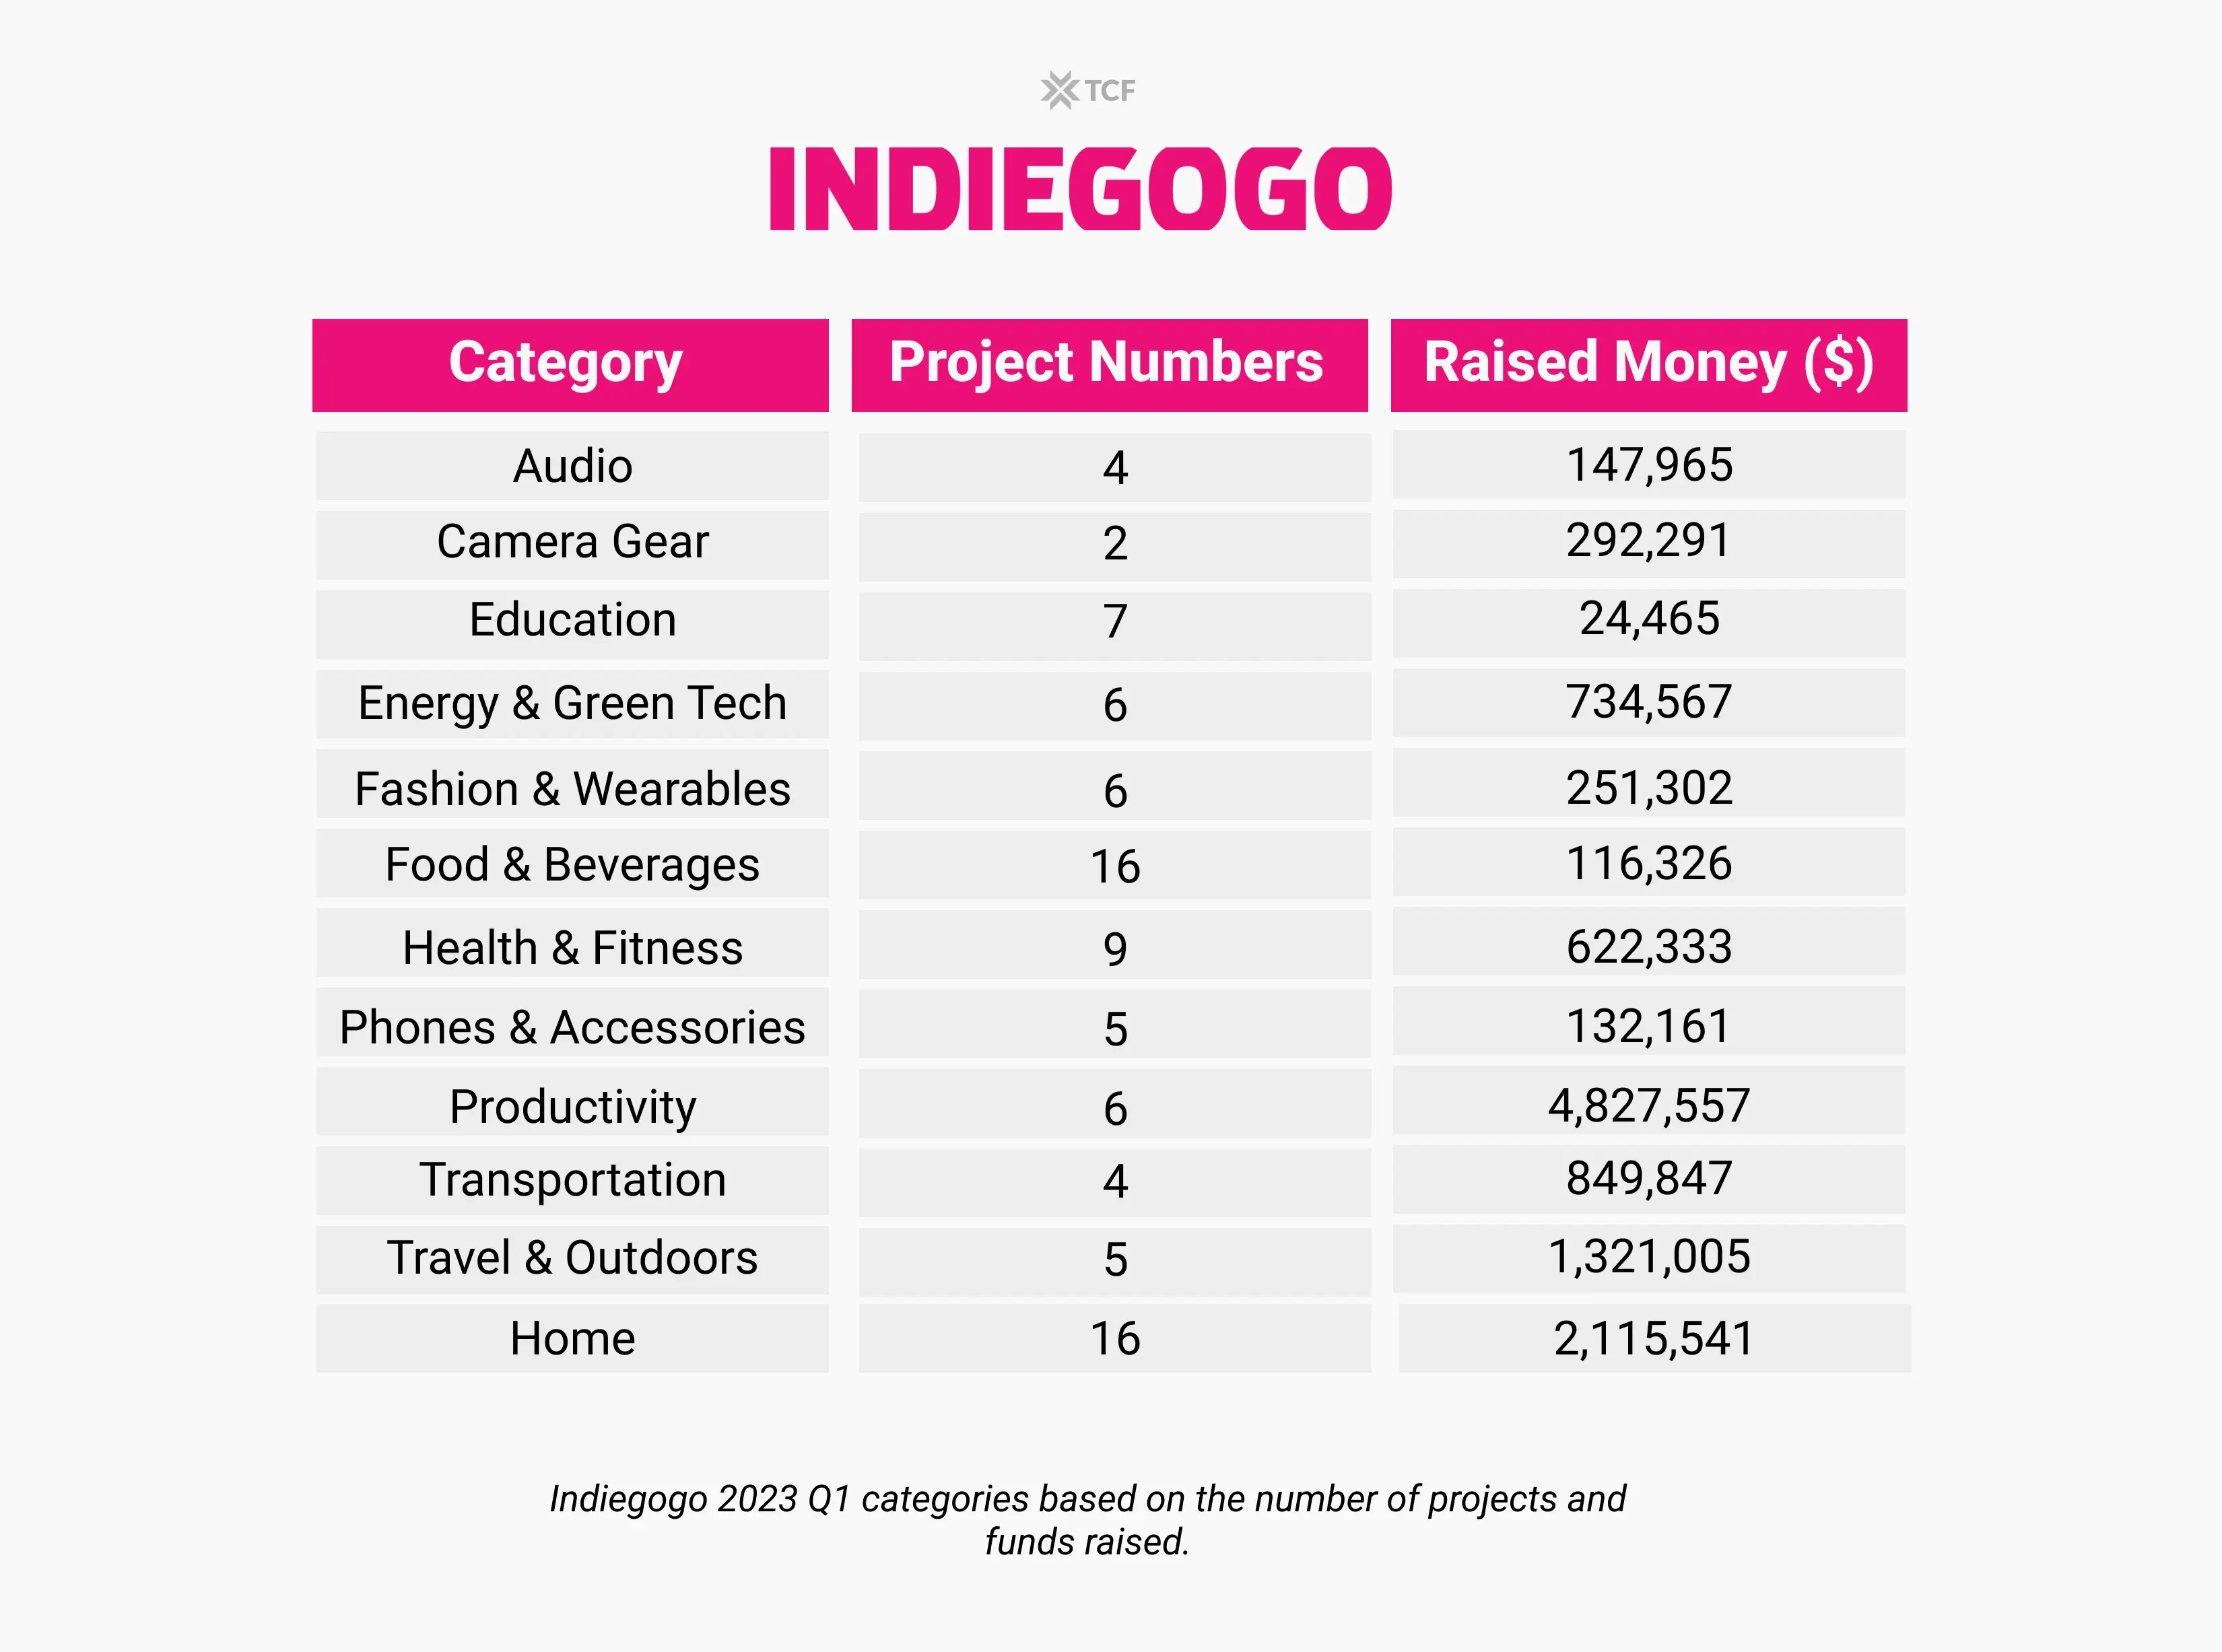
We have sampled 87 projects that launched on Indiegogo. These projects were mainly from the “Audio,” “Camera gear,” “Education,” “Energy and Green Tech,” “Fashion and Wearables,” “Food and Beverages,” “Health and Fitness,” “Home and Gardening,” “Phones and Accessories,” “Productivity, Transportation,” and “Travel and Outdoors” categories.
According to Indiegogo funding statistics, all these categories managed to raise $11.4 million in Q1 of 2023.
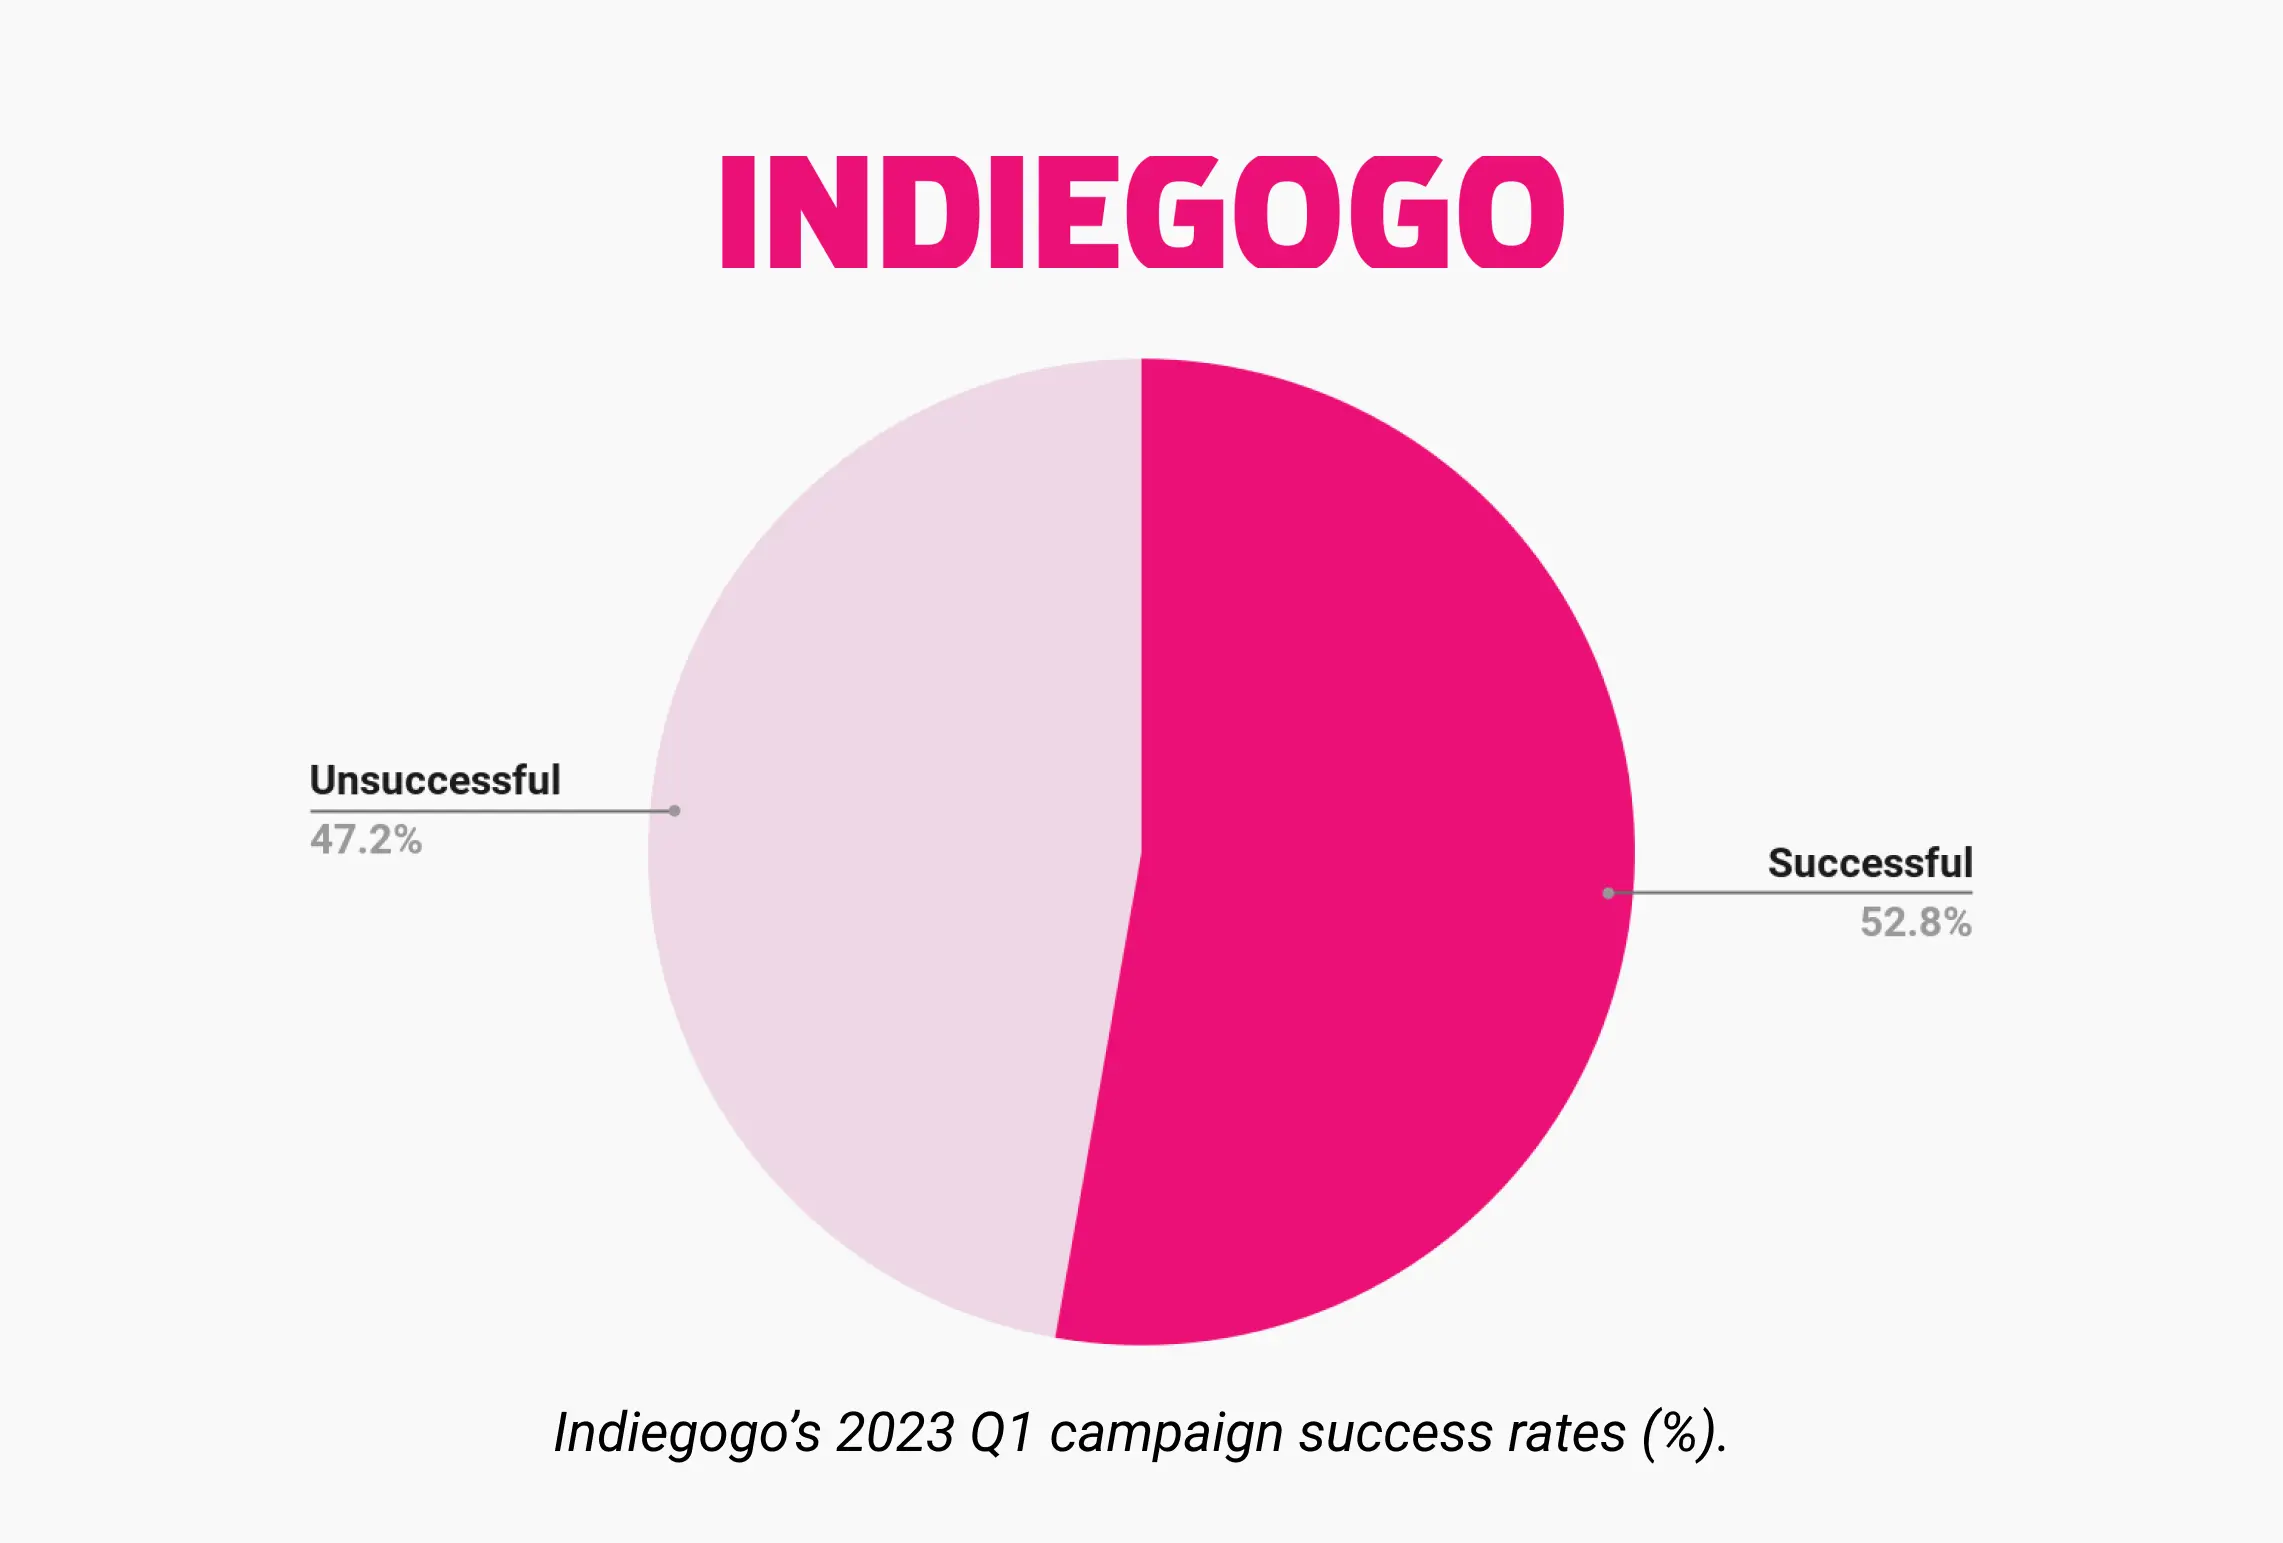
Based on our sample of projects, we have almost equal numbers of successful and unsuccessful projects. The success rate of projects is 52.8%. That’s a high figure for crowdfunding.
An exciting learning we found from Indiegogo is that a large number of unsuccessful projects were canceled even before the end of their campaigns.
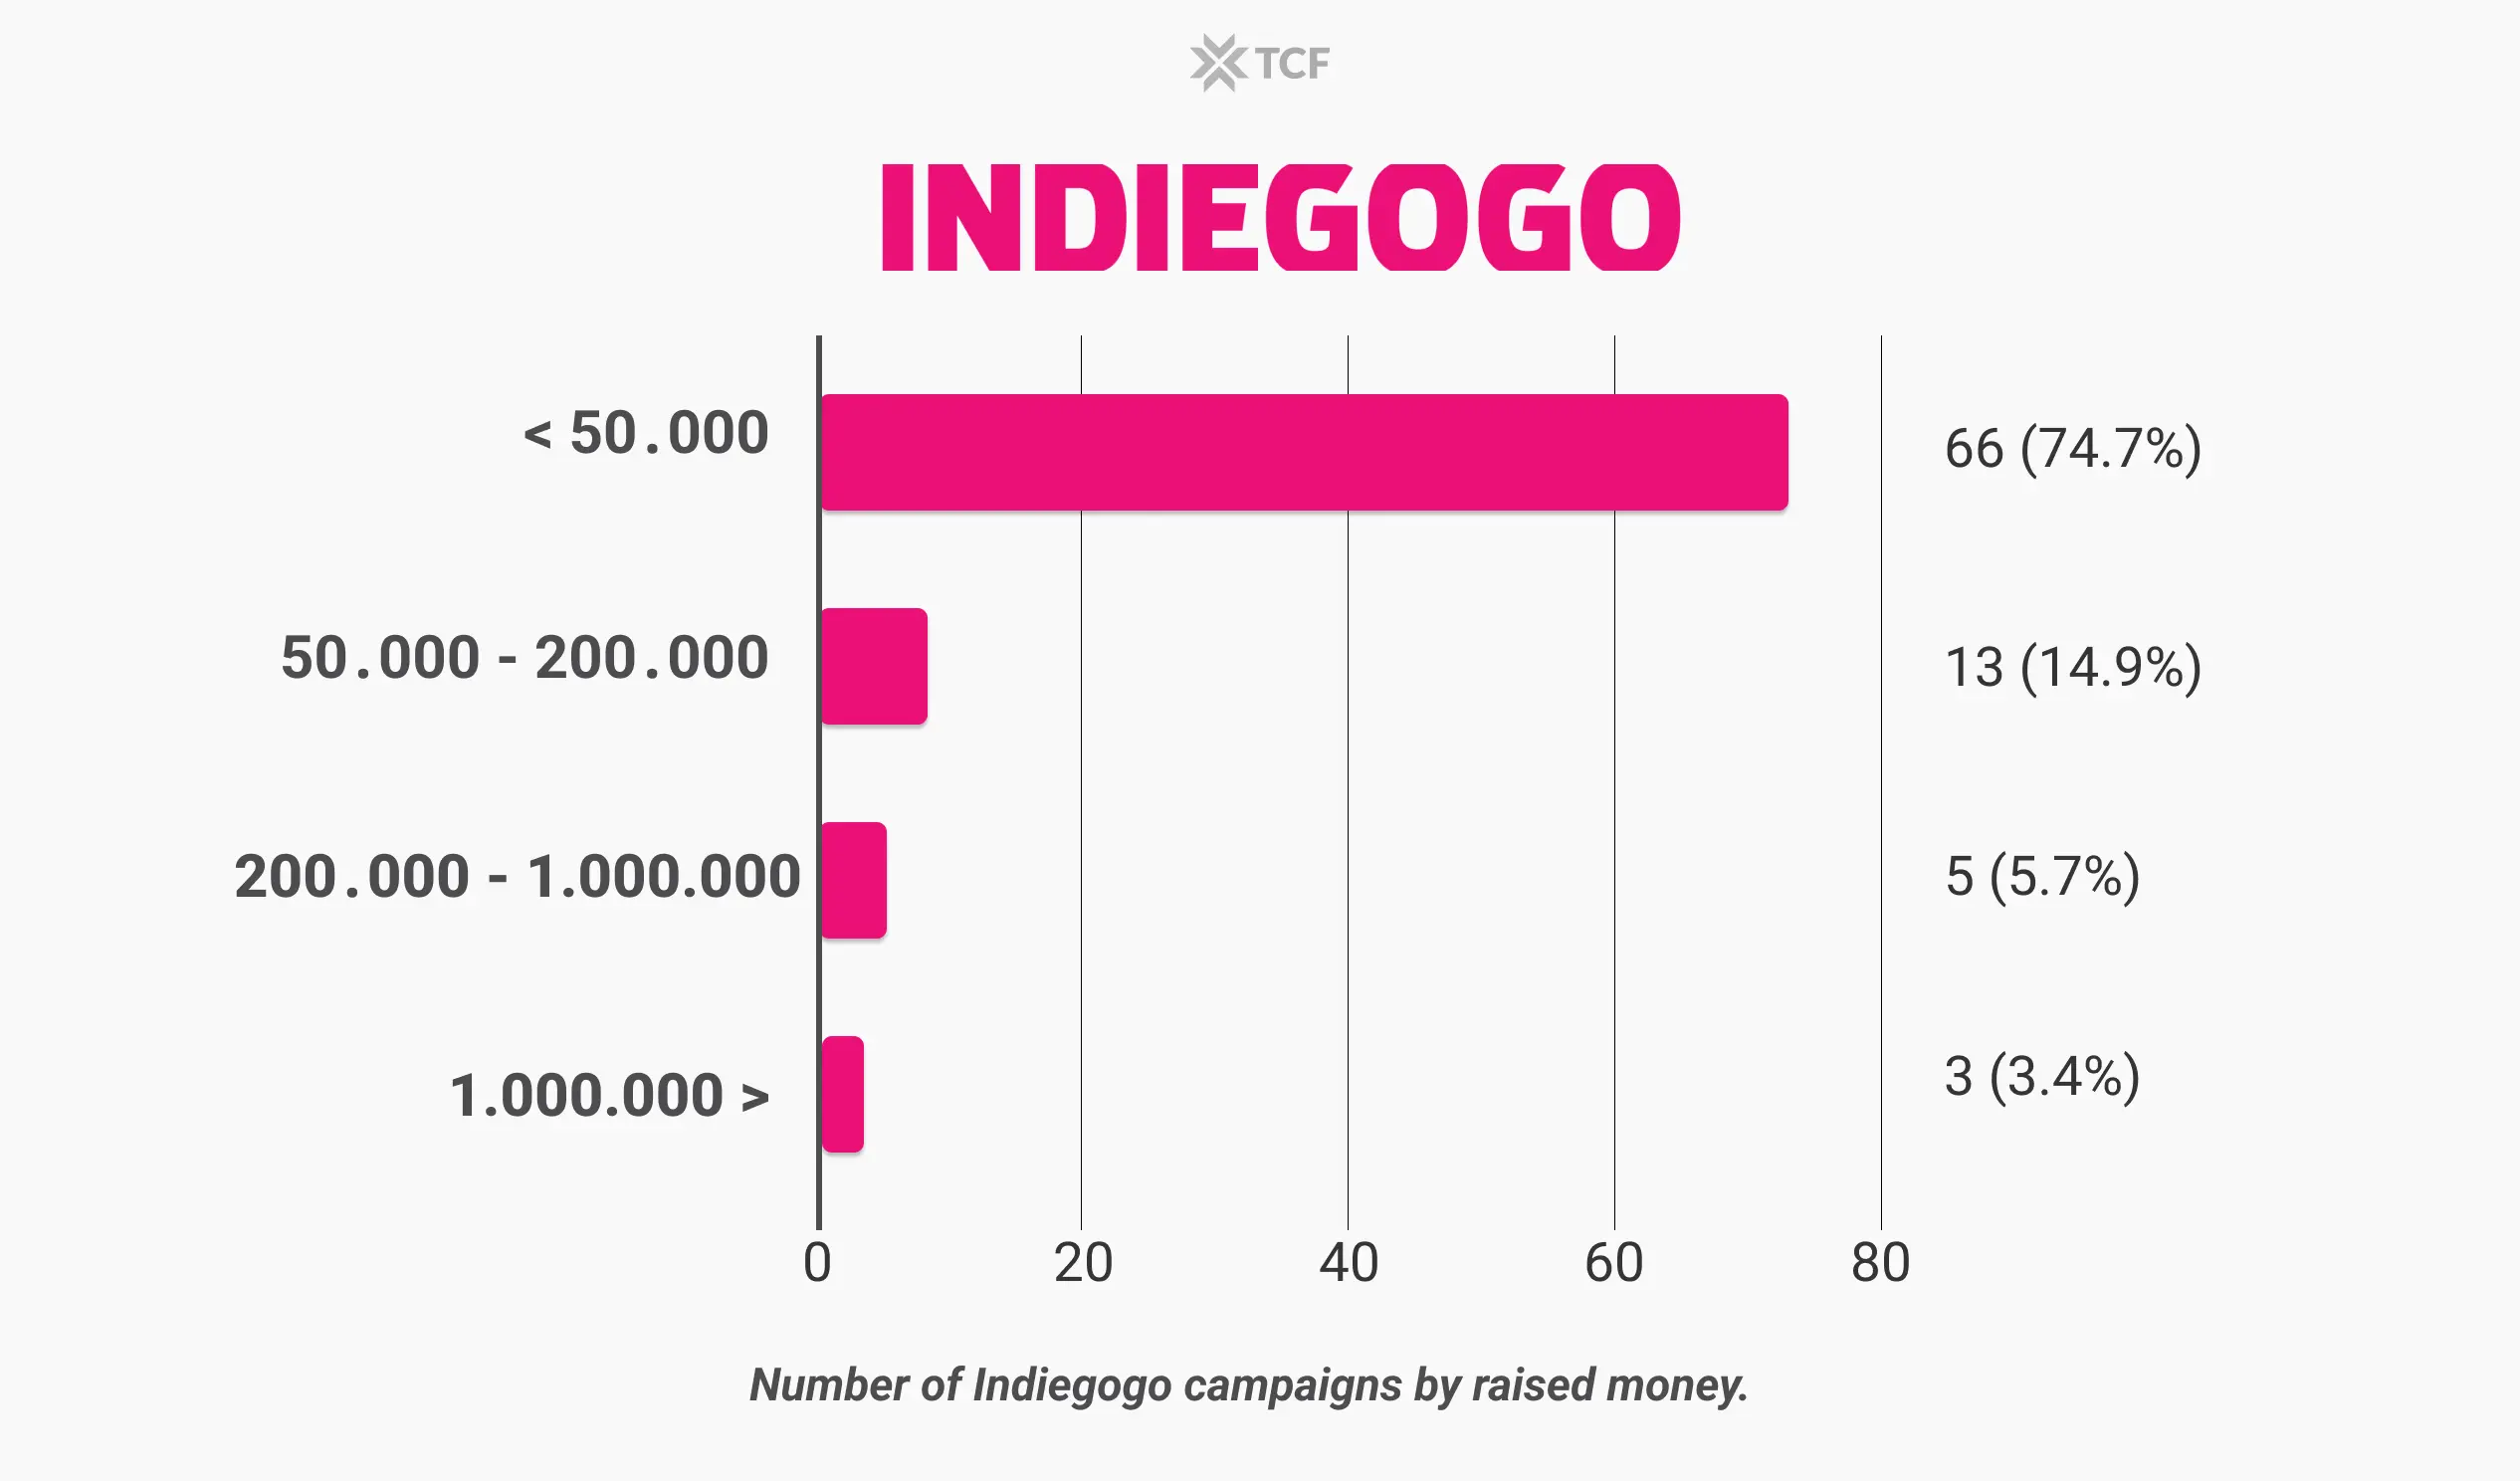
Regarding the amount raised, only 24.1% of projects raised more than $50,000. Most projects (74.7%) didn’t even reach $50,000, and only 3 hit the million-dollar mark.
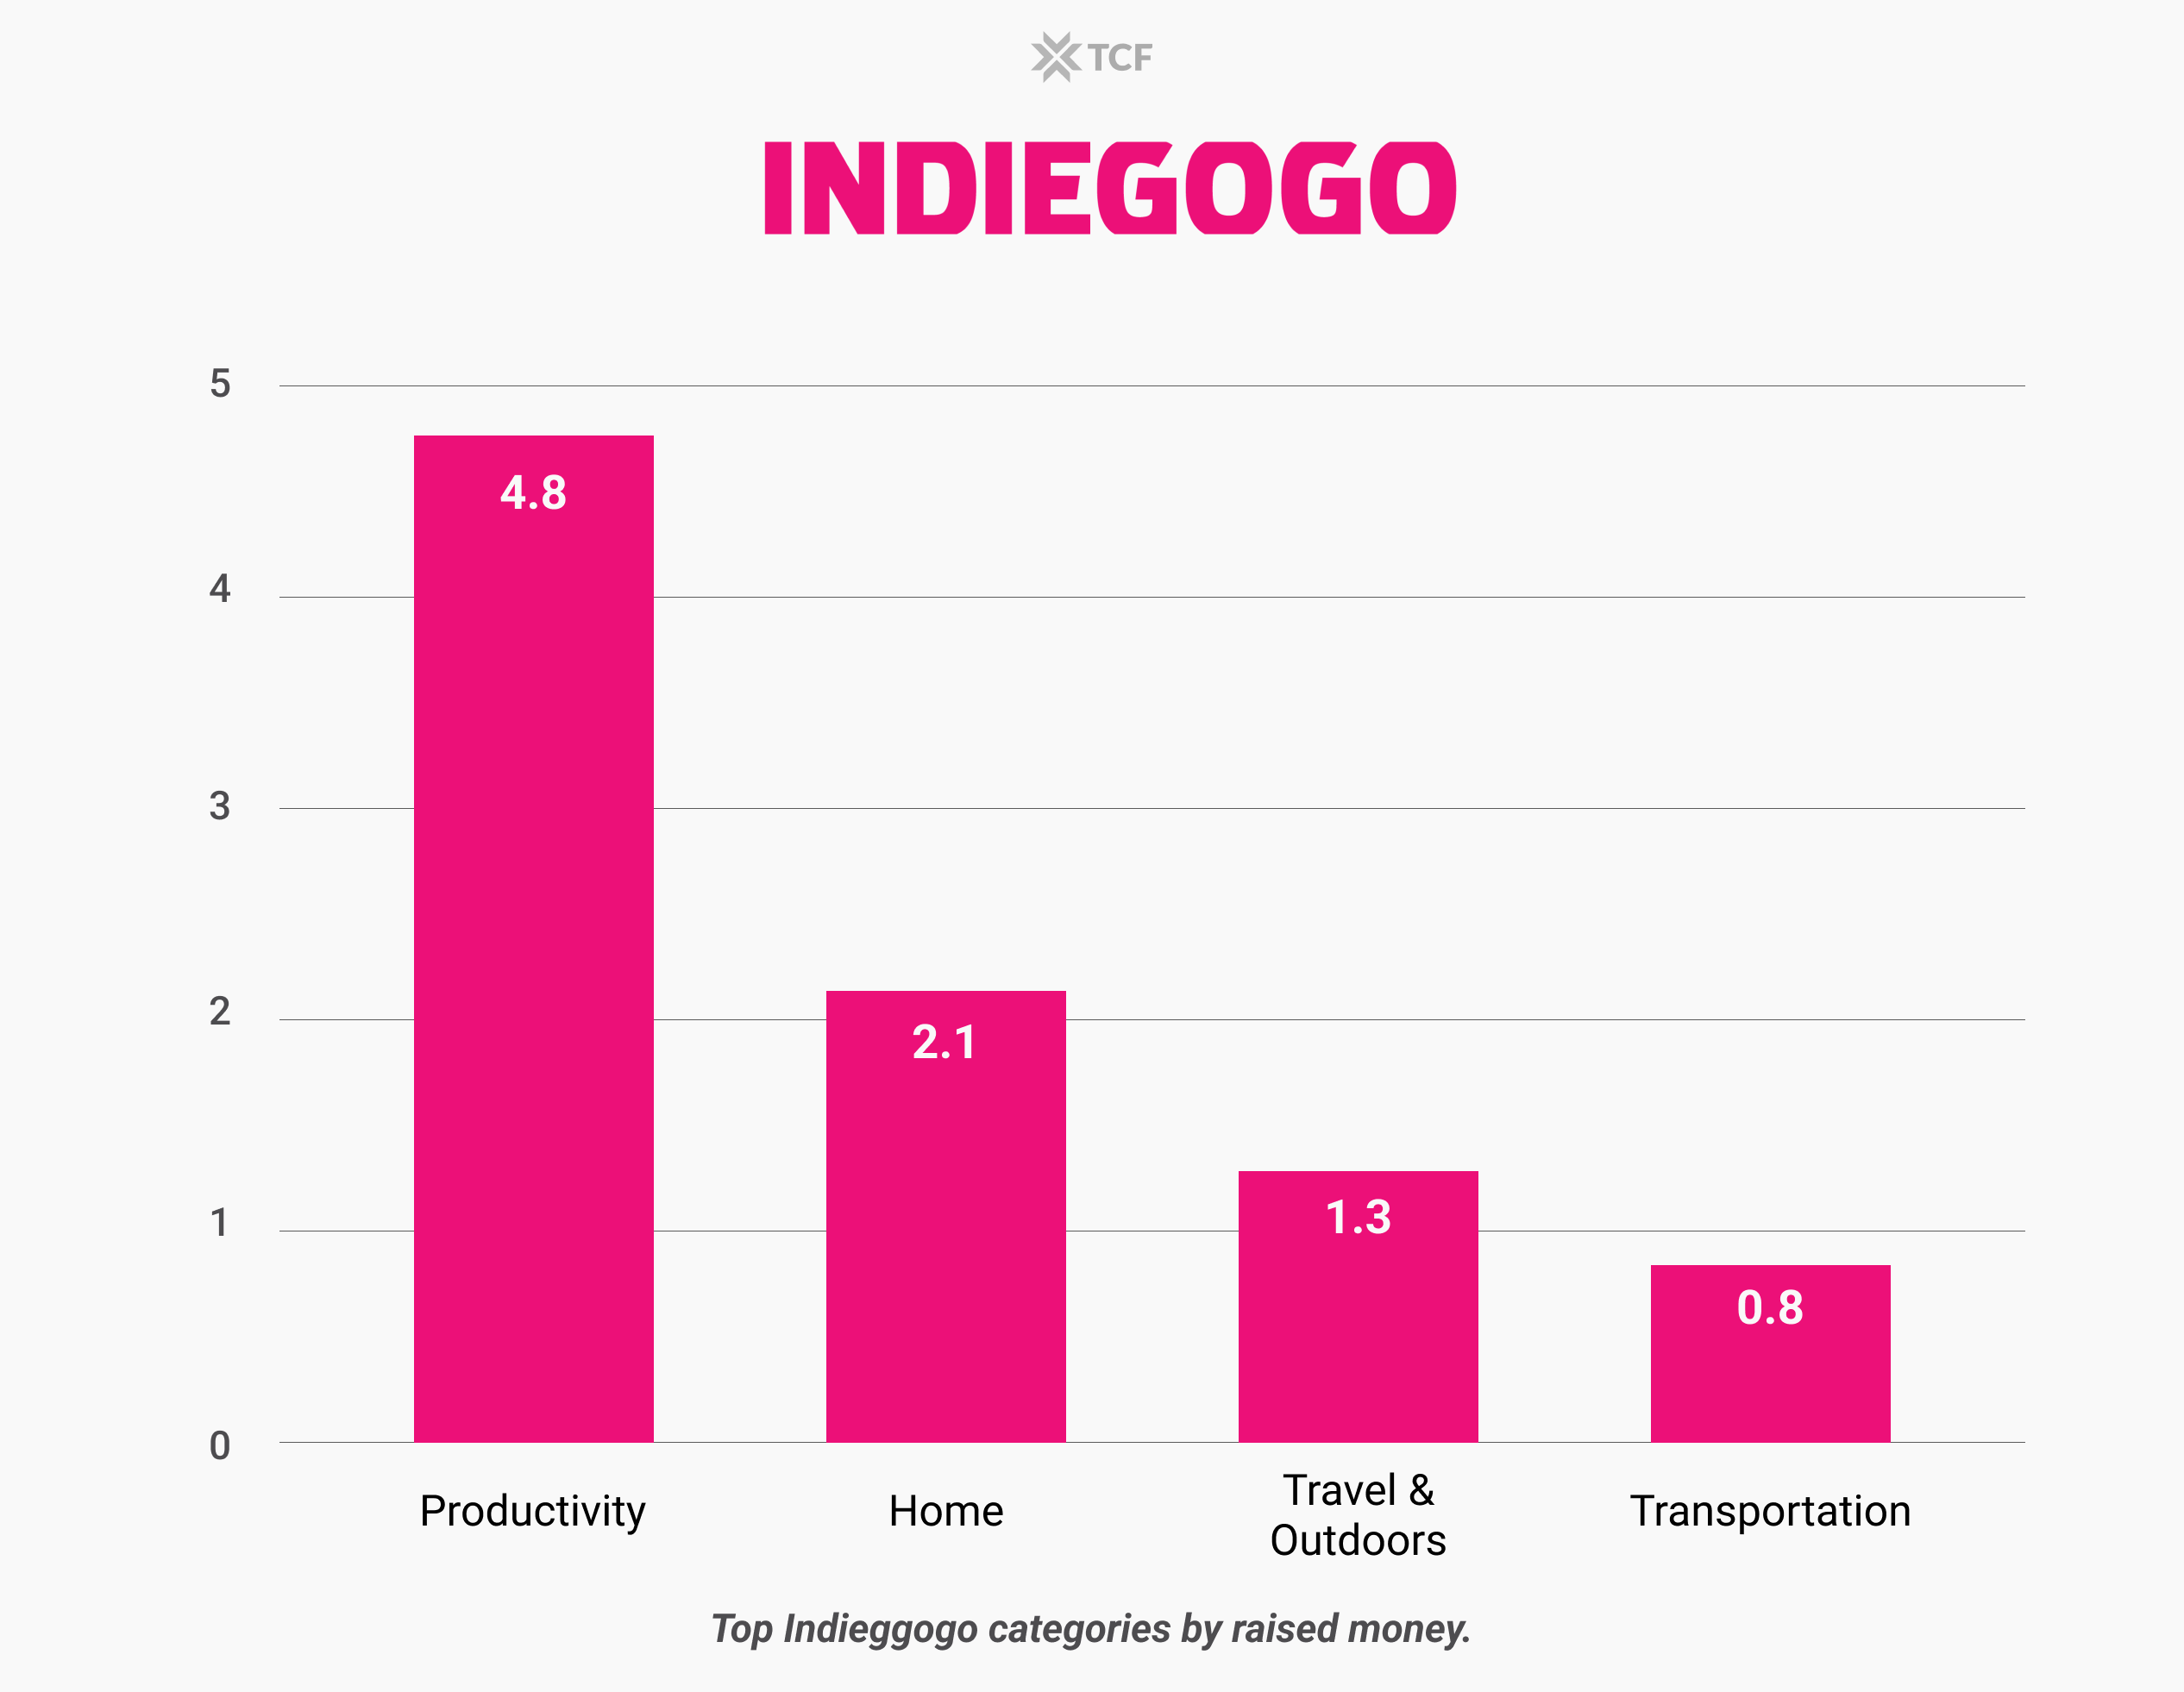
According to our Indiegogo statistics findings, the most successful categories are “Productivity” and “Home.” The percentage of successful projects in these categories is relatively high. The diagram above shows that “Productivity,” “Home,” “Travel,” “Outdoors,” and “Transportation” managed to raise the most money.
This indicates that Indiegogo is a tech-friendly platform where physical products dominate. On the other hand, Kickstarter is a more art-friendly alternative.
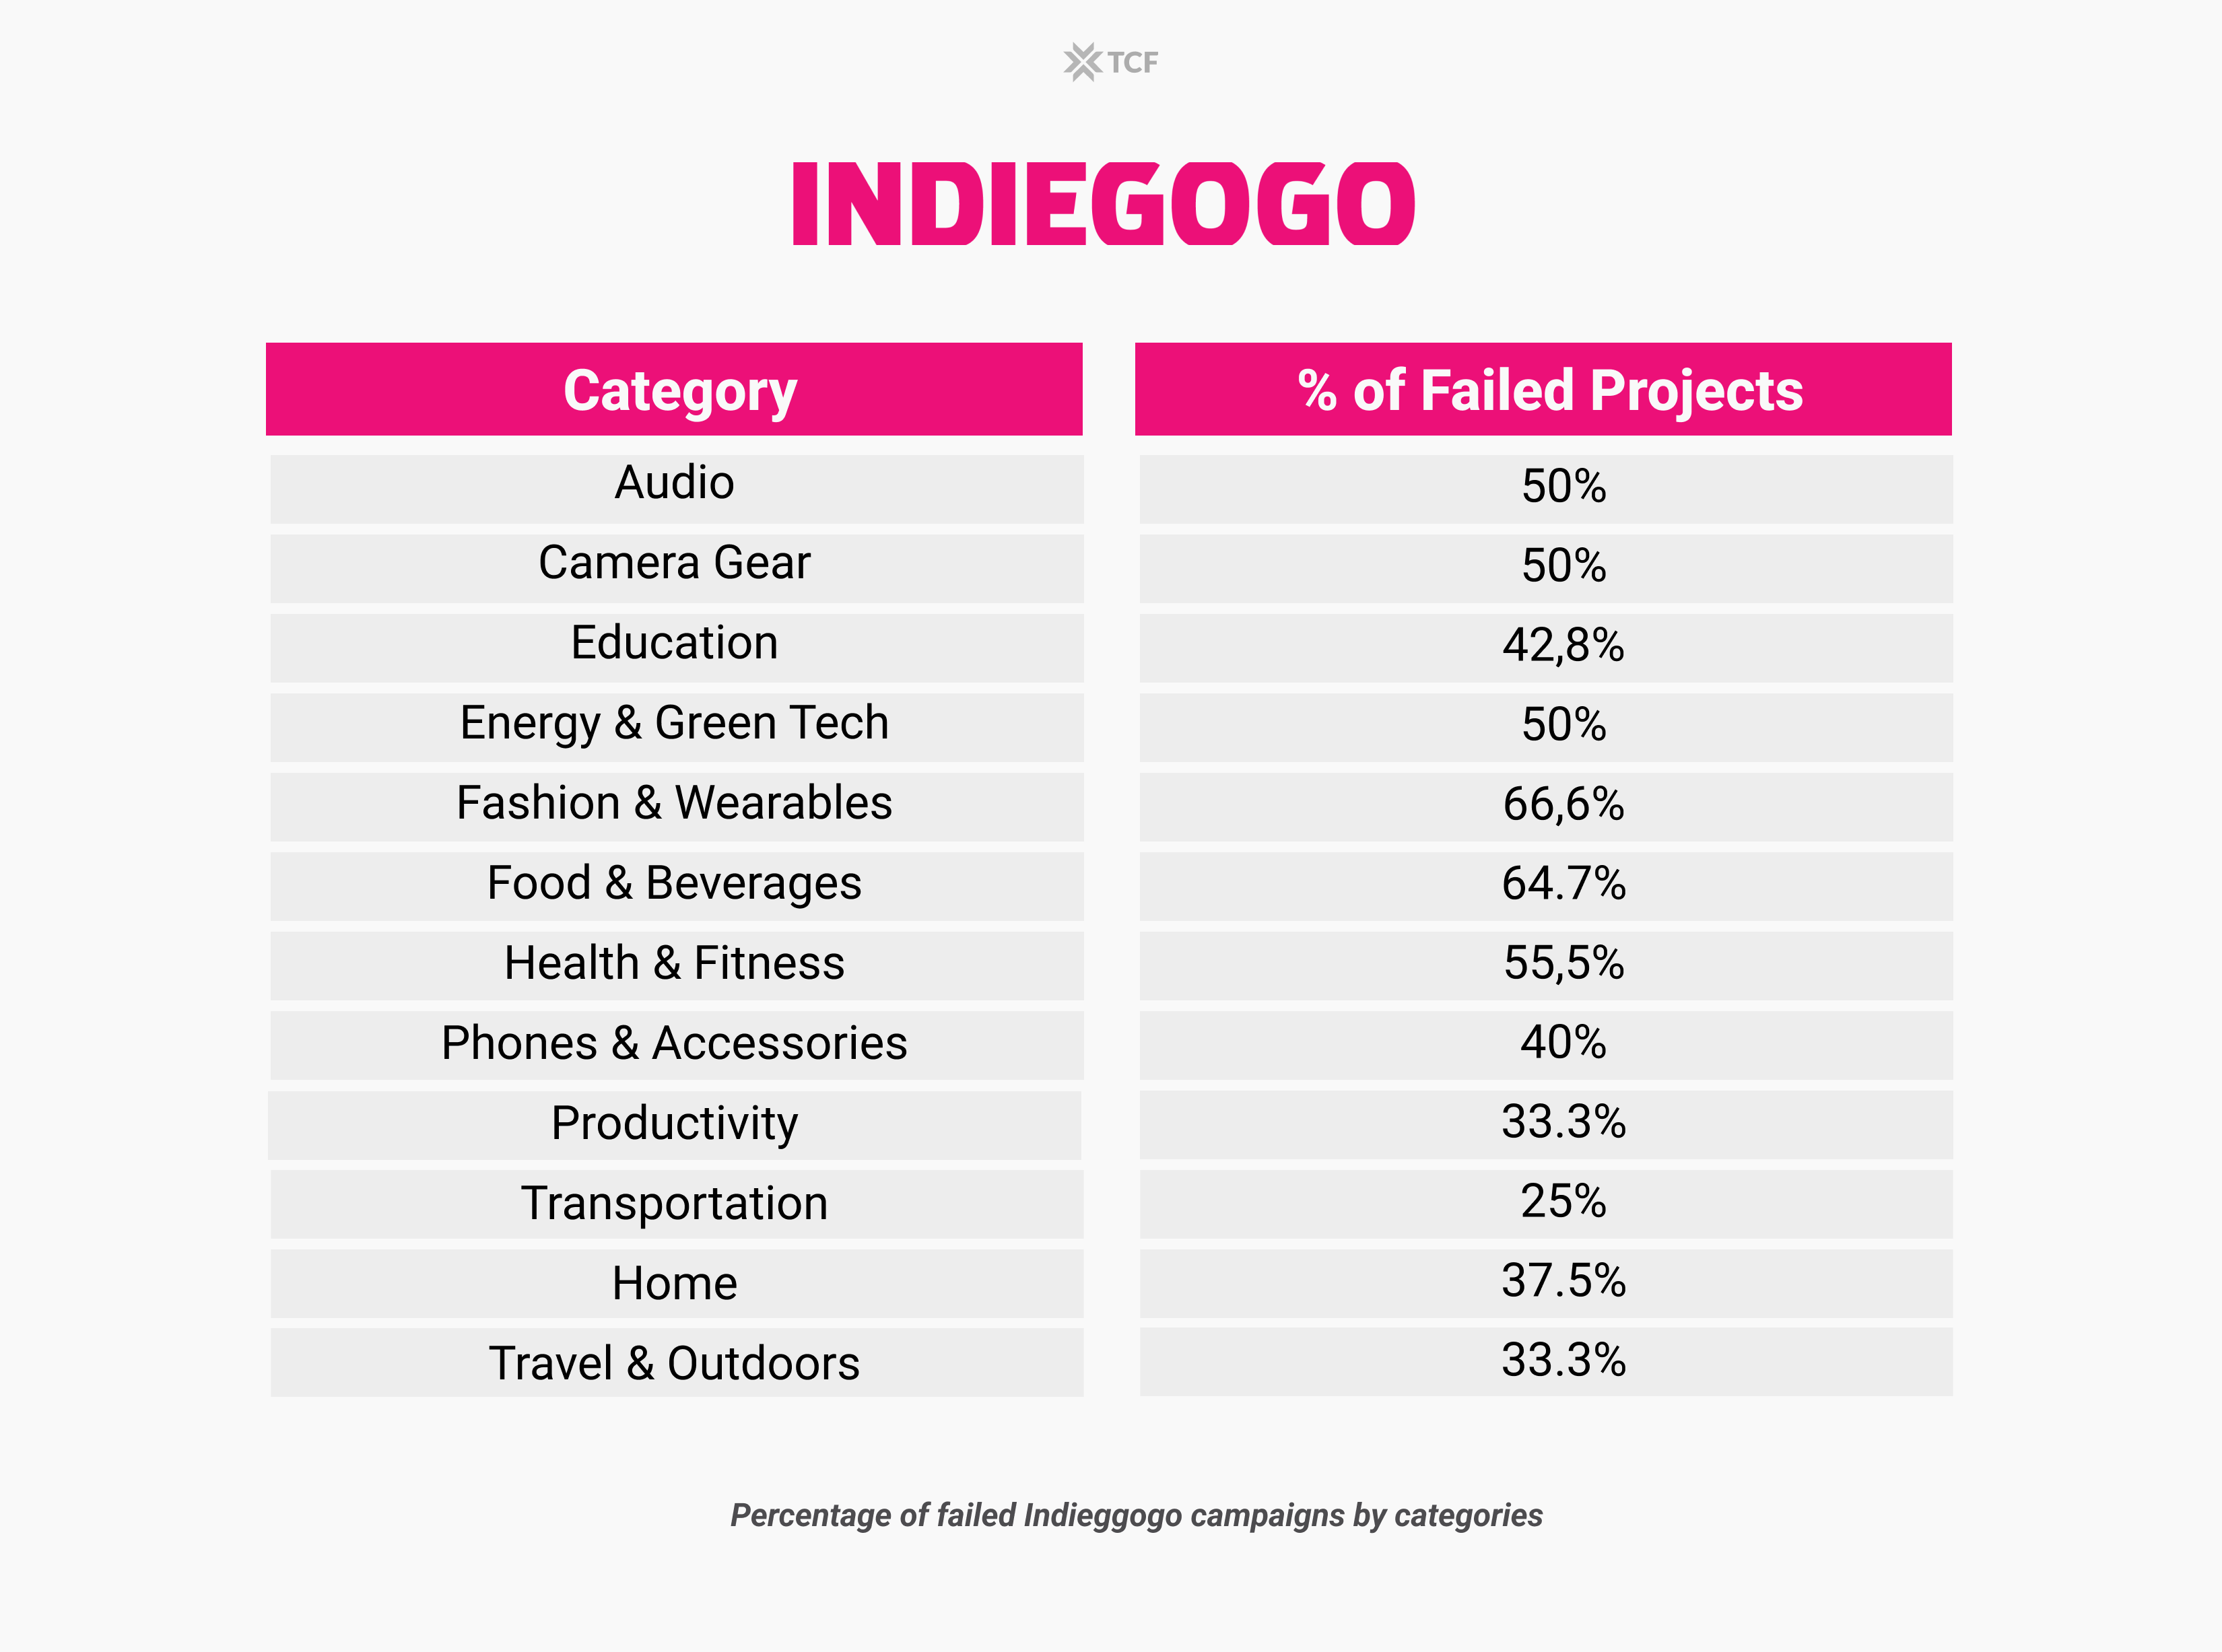
The number of projects launched in each category varies considerably. For example, the “Food and Beverage” category has a lot of projects, but most tend to fail. We can see the same trend in “Fashion,” “Education,” and many other categories of Indiegogo.
To wrap up our Indiegogo campaign statistics guide, let’s finally talk about the trends we saw for Q1 of 2023 on the platform.
What was new on Indiegogo?
Like past years, Indiegogo is still a superior crowdfunding platform for transportation (e-bike, e-scooter), home products, and camera gear. But something new came to the platform this year.
2023 marked the start of a new successful approach – selling the experience of hotel concepts, with the first successful campaign carried out by TCF itself. The project was called the Oculis Lodge, and it managed to raise $1.2 million from 1,752 backers, making it 1 out of the 3 million dollar campaigns for the quarter.
Closure
Looking at the crowdfunding growth statistics across the two platforms, Kickstarter raised way more funds than Indiegogo.
However, the average pledge on Indiegogo was significantly higher than the statistics on Kickstarter. In other words, Indiegogo has considerably fewer backers ready to pay a higher price for better products.
Overall, both Kickstarter and Indiegogo statistics for Q1 of 2023 were full of learnings. We hope you can take these insights and use them to make your next campaign way more successful. Happy raising!
Shavarsh Zohrabyan
Shavarsh is a research and crowdfunding expert and the Head of the Research and Market Analysis department at the Crowdfunding Formula. His main interests are market analysis, business development, operations, etc.
Being an A-level economics and business tutor for over three years, he has excellent knowledge of finance and business-related topics, which comes in handy while doing research for crowdfunding campaigns.
Comments
Leave a Reply
Maximizing Success in Your 2024 Crowdfunding PR Campaign


Comments